Norwegian vs Immigrants from Armenia Average Family Size
COMPARE
Norwegian
Immigrants from Armenia
Average Family Size
Average Family Size Comparison
Norwegians
Immigrants from Armenia
3.08
AVERAGE FAMILY SIZE
0.0/ 100
METRIC RATING
343rd/ 347
METRIC RANK
3.35
AVERAGE FAMILY SIZE
100.0/ 100
METRIC RATING
60th/ 347
METRIC RANK
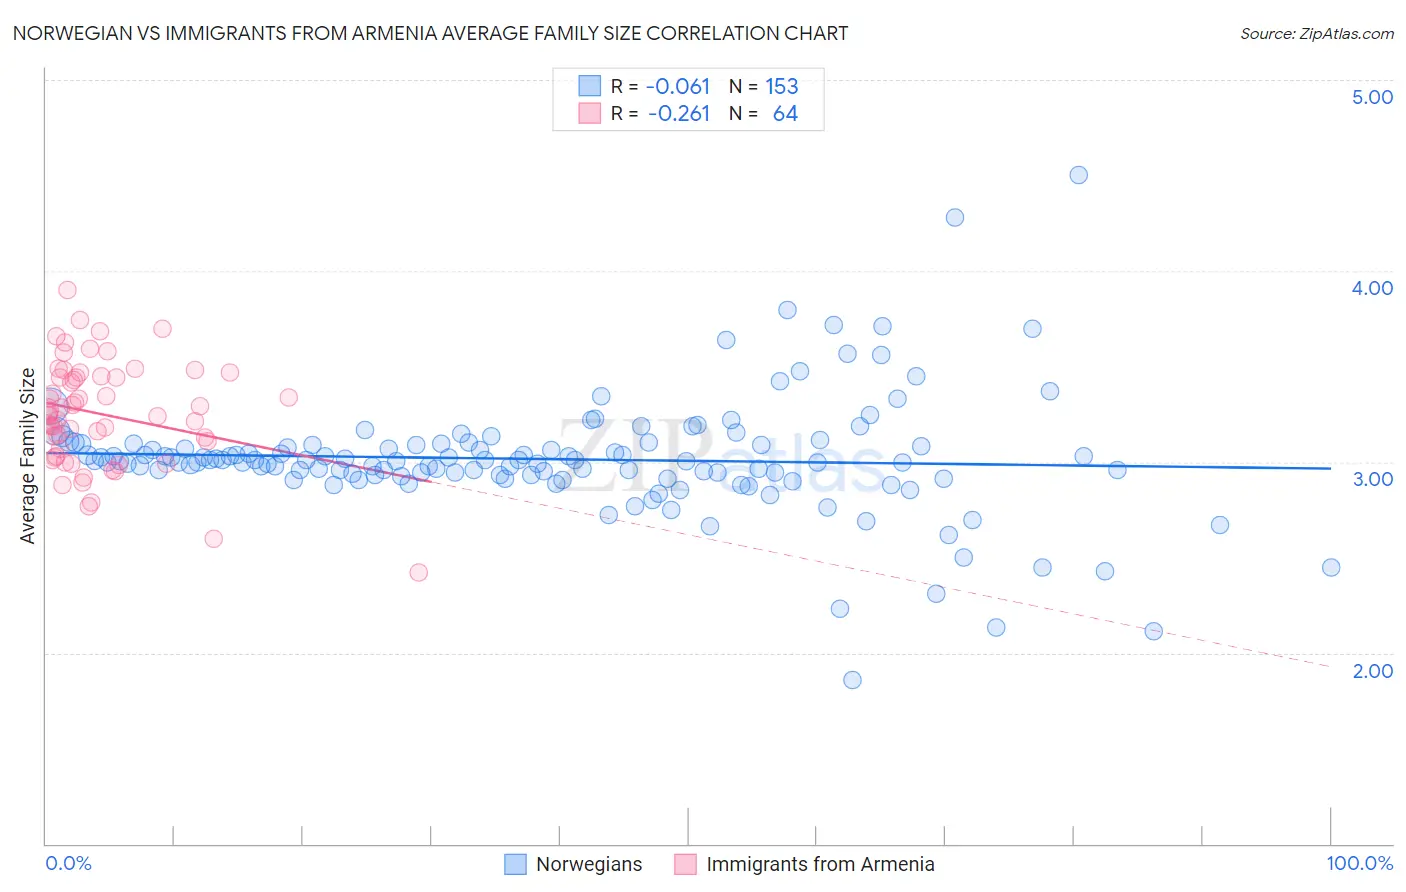
Norwegian vs Immigrants from Armenia Average Family Size Correlation Chart
The statistical analysis conducted on geographies consisting of 532,913,182 people shows a slight negative correlation between the proportion of Norwegians and average family size in the United States with a correlation coefficient (R) of -0.061 and weighted average of 3.08. Similarly, the statistical analysis conducted on geographies consisting of 97,714,180 people shows a weak negative correlation between the proportion of Immigrants from Armenia and average family size in the United States with a correlation coefficient (R) of -0.261 and weighted average of 3.35, a difference of 8.6%.
Average Family Size Correlation Summary
| Measurement | Norwegian | Immigrants from Armenia |
| Minimum | 1.86 | 2.42 |
| Maximum | 4.50 | 3.90 |
| Range | 2.64 | 1.48 |
| Mean | 3.01 | 3.25 |
| Median | 3.00 | 3.25 |
| Interquartile 25% (IQ1) | 2.93 | 3.05 |
| Interquartile 75% (IQ3) | 3.09 | 3.45 |
| Interquartile Range (IQR) | 0.16 | 0.40 |
| Standard Deviation (Sample) | 0.31 | 0.28 |
| Standard Deviation (Population) | 0.31 | 0.28 |
Similar Demographics by Average Family Size
Demographics Similar to Norwegians by Average Family Size
In terms of average family size, the demographic groups most similar to Norwegians are German (3.09, a difference of 0.23%), French Canadian (3.07, a difference of 0.24%), Slovene (3.07, a difference of 0.28%), Polish (3.09, a difference of 0.37%), and Finnish (3.09, a difference of 0.42%).
| Demographics | Rating | Rank | Average Family Size |
| Estonians | 0.0 /100 | #333 | Tragic 3.10 |
| Lithuanians | 0.0 /100 | #334 | Tragic 3.10 |
| Luxembourgers | 0.0 /100 | #335 | Tragic 3.10 |
| Irish | 0.0 /100 | #336 | Tragic 3.10 |
| Swedes | 0.0 /100 | #337 | Tragic 3.10 |
| French | 0.0 /100 | #338 | Tragic 3.10 |
| Croatians | 0.0 /100 | #339 | Tragic 3.10 |
| Finns | 0.0 /100 | #340 | Tragic 3.09 |
| Poles | 0.0 /100 | #341 | Tragic 3.09 |
| Germans | 0.0 /100 | #342 | Tragic 3.09 |
| Norwegians | 0.0 /100 | #343 | Tragic 3.08 |
| French Canadians | 0.0 /100 | #344 | Tragic 3.07 |
| Slovenes | 0.0 /100 | #345 | Tragic 3.07 |
| Slovaks | 0.0 /100 | #346 | Tragic 3.06 |
| Carpatho Rusyns | 0.0 /100 | #347 | Tragic 3.06 |
Demographics Similar to Immigrants from Armenia by Average Family Size
In terms of average family size, the demographic groups most similar to Immigrants from Armenia are Japanese (3.35, a difference of 0.020%), Central American Indian (3.35, a difference of 0.030%), Honduran (3.35, a difference of 0.11%), Sri Lankan (3.35, a difference of 0.12%), and Immigrants from Dominican Republic (3.35, a difference of 0.18%).
| Demographics | Rating | Rank | Average Family Size |
| Koreans | 100.0 /100 | #53 | Exceptional 3.36 |
| Immigrants | South Eastern Asia | 100.0 /100 | #54 | Exceptional 3.36 |
| Immigrants | Honduras | 100.0 /100 | #55 | Exceptional 3.36 |
| Immigrants | Dominican Republic | 100.0 /100 | #56 | Exceptional 3.35 |
| Sri Lankans | 100.0 /100 | #57 | Exceptional 3.35 |
| Hondurans | 100.0 /100 | #58 | Exceptional 3.35 |
| Japanese | 100.0 /100 | #59 | Exceptional 3.35 |
| Immigrants | Armenia | 100.0 /100 | #60 | Exceptional 3.35 |
| Central American Indians | 100.0 /100 | #61 | Exceptional 3.35 |
| Immigrants | Grenada | 100.0 /100 | #62 | Exceptional 3.34 |
| Chinese | 100.0 /100 | #63 | Exceptional 3.34 |
| Dominicans | 99.9 /100 | #64 | Exceptional 3.34 |
| Immigrants | Laos | 99.9 /100 | #65 | Exceptional 3.34 |
| Immigrants | St. Vincent and the Grenadines | 99.9 /100 | #66 | Exceptional 3.34 |
| Immigrants | Jamaica | 99.9 /100 | #67 | Exceptional 3.33 |