Immigrants from Sudan vs Burmese Average Family Size
COMPARE
Immigrants from Sudan
Burmese
Average Family Size
Average Family Size Comparison
Immigrants from Sudan
Burmese
3.22
AVERAGE FAMILY SIZE
29.1/ 100
METRIC RATING
194th/ 347
METRIC RANK
3.22
AVERAGE FAMILY SIZE
31.0/ 100
METRIC RATING
190th/ 347
METRIC RANK
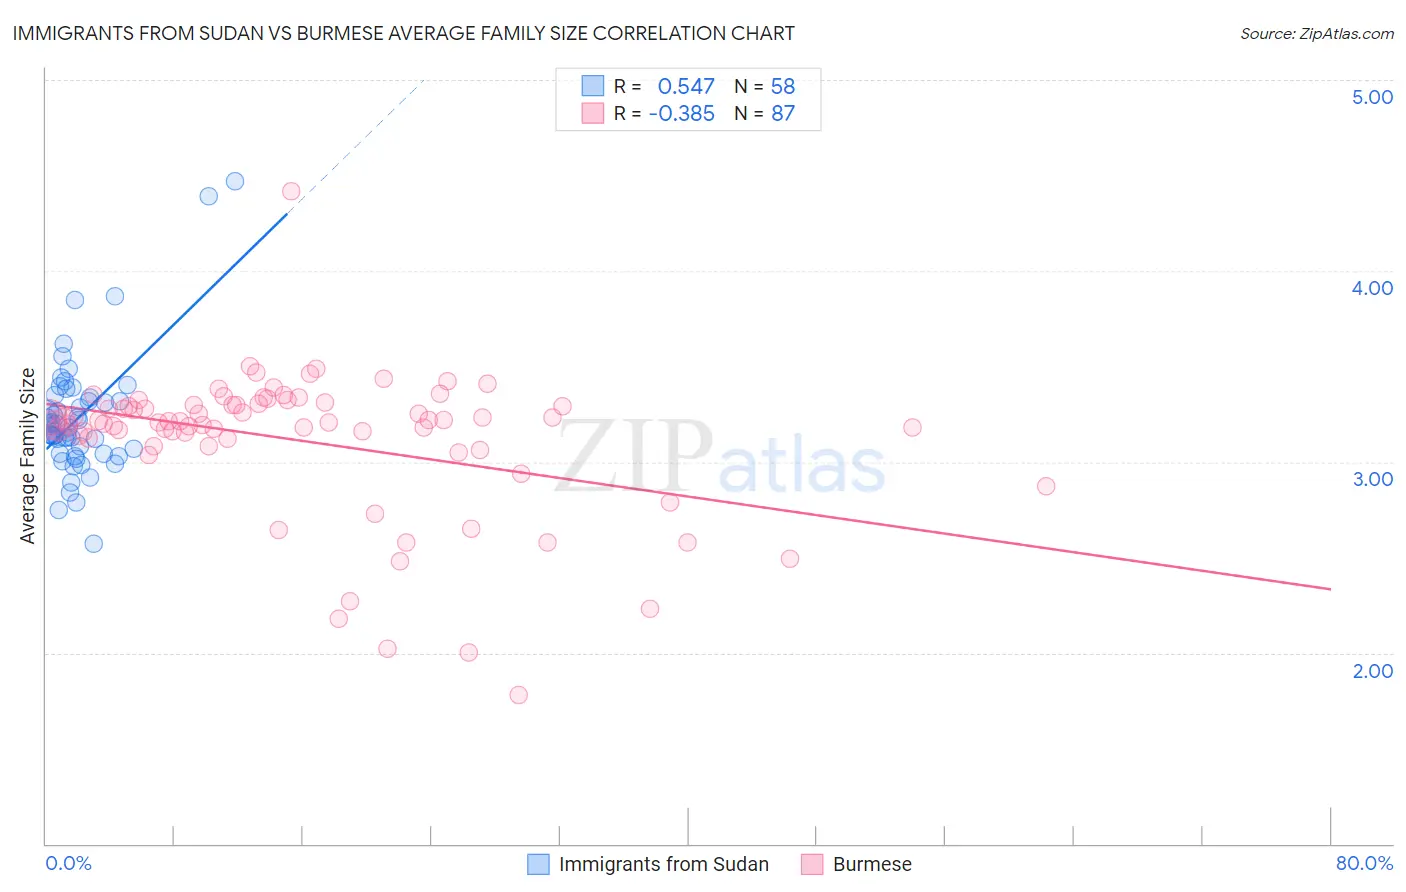
Immigrants from Sudan vs Burmese Average Family Size Correlation Chart
The statistical analysis conducted on geographies consisting of 118,946,972 people shows a substantial positive correlation between the proportion of Immigrants from Sudan and average family size in the United States with a correlation coefficient (R) of 0.547 and weighted average of 3.22. Similarly, the statistical analysis conducted on geographies consisting of 464,897,225 people shows a mild negative correlation between the proportion of Burmese and average family size in the United States with a correlation coefficient (R) of -0.385 and weighted average of 3.22, a difference of 0.040%.
Average Family Size Correlation Summary
| Measurement | Immigrants from Sudan | Burmese |
| Minimum | 2.57 | 1.78 |
| Maximum | 4.47 | 4.42 |
| Range | 1.90 | 2.64 |
| Mean | 3.23 | 3.11 |
| Median | 3.18 | 3.21 |
| Interquartile 25% (IQ1) | 3.04 | 3.08 |
| Interquartile 75% (IQ3) | 3.34 | 3.30 |
| Interquartile Range (IQR) | 0.30 | 0.22 |
| Standard Deviation (Sample) | 0.33 | 0.39 |
| Standard Deviation (Population) | 0.32 | 0.38 |
Demographics Similar to Immigrants from Sudan and Burmese by Average Family Size
In terms of average family size, the demographic groups most similar to Immigrants from Sudan are Immigrants from Israel (3.22, a difference of 0.0%), Immigrants from Eastern Africa (3.22, a difference of 0.020%), Choctaw (3.21, a difference of 0.020%), Senegalese (3.21, a difference of 0.020%), and Kenyan (3.21, a difference of 0.020%). Similarly, the demographic groups most similar to Burmese are Immigrants from Zaire (3.22, a difference of 0.010%), Immigrants from Eastern Africa (3.22, a difference of 0.020%), Immigrants from Israel (3.22, a difference of 0.040%), Pakistani (3.22, a difference of 0.060%), and Choctaw (3.21, a difference of 0.060%).
| Demographics | Rating | Rank | Average Family Size |
| Moroccans | 44.2 /100 | #182 | Average 3.22 |
| Immigrants | Northern Africa | 41.7 /100 | #183 | Average 3.22 |
| Immigrants | Eastern Asia | 40.8 /100 | #184 | Average 3.22 |
| Immigrants | Sri Lanka | 39.8 /100 | #185 | Fair 3.22 |
| Immigrants | Argentina | 39.8 /100 | #186 | Fair 3.22 |
| Immigrants | Malaysia | 39.0 /100 | #187 | Fair 3.22 |
| Thais | 38.3 /100 | #188 | Fair 3.22 |
| Pakistanis | 33.7 /100 | #189 | Fair 3.22 |
| Burmese | 31.0 /100 | #190 | Fair 3.22 |
| Immigrants | Zaire | 30.5 /100 | #191 | Fair 3.22 |
| Immigrants | Eastern Africa | 30.1 /100 | #192 | Fair 3.22 |
| Immigrants | Israel | 29.3 /100 | #193 | Fair 3.22 |
| Immigrants | Sudan | 29.1 /100 | #194 | Fair 3.22 |
| Choctaw | 28.3 /100 | #195 | Fair 3.21 |
| Senegalese | 28.2 /100 | #196 | Fair 3.21 |
| Kenyans | 28.0 /100 | #197 | Fair 3.21 |
| Immigrants | Azores | 21.7 /100 | #198 | Fair 3.21 |
| Hmong | 20.7 /100 | #199 | Fair 3.21 |
| Immigrants | Kenya | 19.2 /100 | #200 | Poor 3.21 |
| Immigrants | Morocco | 18.5 /100 | #201 | Poor 3.21 |
| Immigrants | India | 18.5 /100 | #202 | Poor 3.21 |