Immigrants from Korea vs Burmese Average Family Size
COMPARE
Immigrants from Korea
Burmese
Average Family Size
Average Family Size Comparison
Immigrants from Korea
Burmese
3.23
AVERAGE FAMILY SIZE
46.9/ 100
METRIC RATING
179th/ 347
METRIC RANK
3.22
AVERAGE FAMILY SIZE
31.0/ 100
METRIC RATING
190th/ 347
METRIC RANK
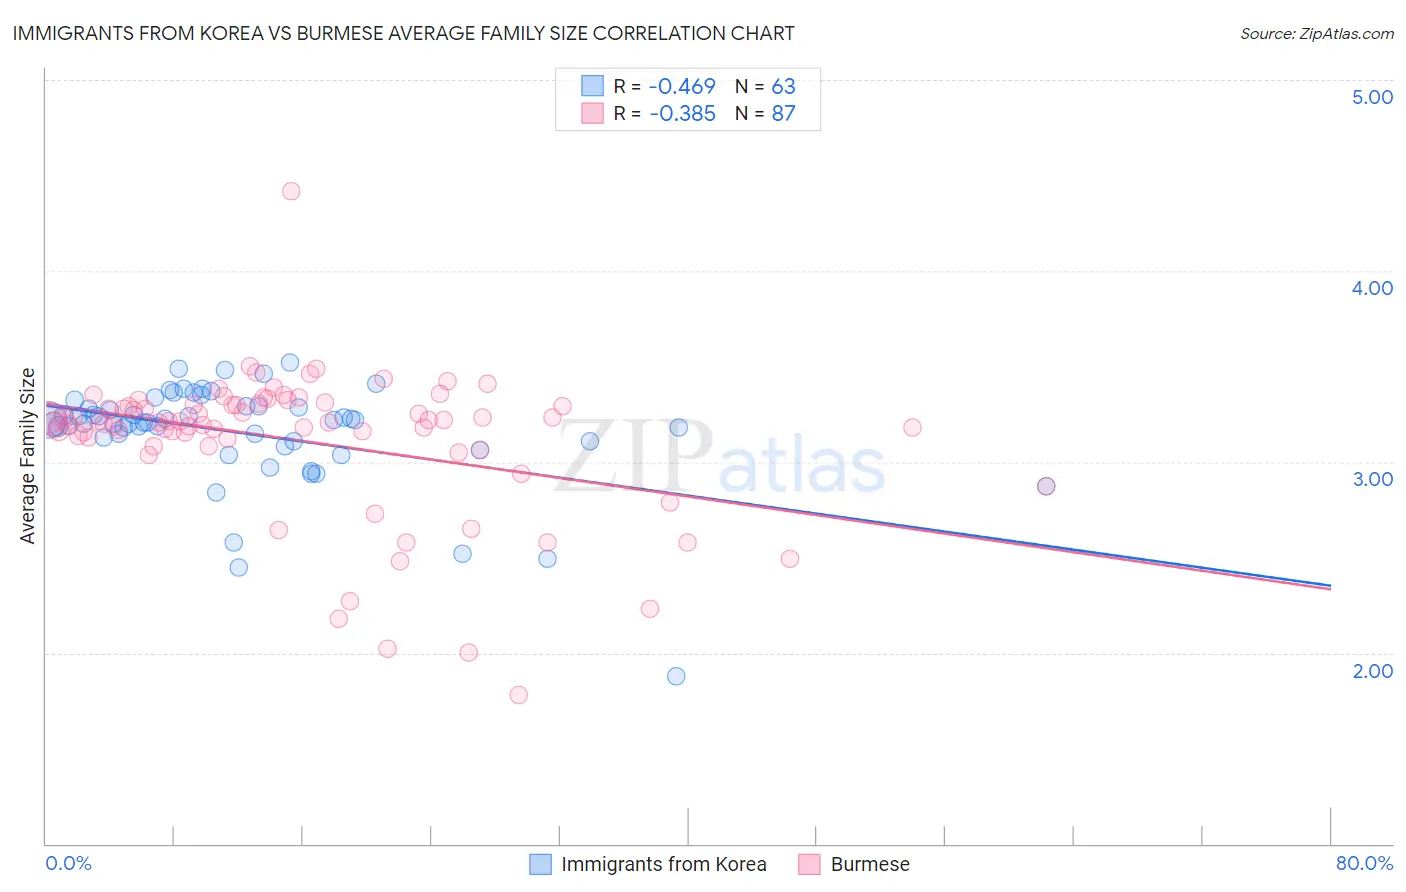
Immigrants from Korea vs Burmese Average Family Size Correlation Chart
The statistical analysis conducted on geographies consisting of 415,975,423 people shows a moderate negative correlation between the proportion of Immigrants from Korea and average family size in the United States with a correlation coefficient (R) of -0.469 and weighted average of 3.23. Similarly, the statistical analysis conducted on geographies consisting of 464,897,225 people shows a mild negative correlation between the proportion of Burmese and average family size in the United States with a correlation coefficient (R) of -0.385 and weighted average of 3.22, a difference of 0.31%.
Average Family Size Correlation Summary
| Measurement | Immigrants from Korea | Burmese |
| Minimum | 1.88 | 1.78 |
| Maximum | 3.52 | 4.42 |
| Range | 1.64 | 2.64 |
| Mean | 3.15 | 3.11 |
| Median | 3.21 | 3.21 |
| Interquartile 25% (IQ1) | 3.11 | 3.08 |
| Interquartile 75% (IQ3) | 3.29 | 3.30 |
| Interquartile Range (IQR) | 0.18 | 0.22 |
| Standard Deviation (Sample) | 0.28 | 0.39 |
| Standard Deviation (Population) | 0.27 | 0.38 |
Demographics Similar to Immigrants from Korea and Burmese by Average Family Size
In terms of average family size, the demographic groups most similar to Immigrants from Korea are Argentinean (3.23, a difference of 0.010%), Spaniard (3.23, a difference of 0.010%), Palestinian (3.23, a difference of 0.010%), Israeli (3.23, a difference of 0.030%), and Spanish (3.23, a difference of 0.040%). Similarly, the demographic groups most similar to Burmese are Immigrants from Zaire (3.22, a difference of 0.010%), Immigrants from Eastern Africa (3.22, a difference of 0.020%), Immigrants from Israel (3.22, a difference of 0.040%), Immigrants from Sudan (3.22, a difference of 0.040%), and Pakistani (3.22, a difference of 0.060%).
| Demographics | Rating | Rank | Average Family Size |
| Immigrants | South Central Asia | 50.0 /100 | #174 | Average 3.23 |
| Immigrants | China | 49.9 /100 | #175 | Average 3.23 |
| Israelis | 48.7 /100 | #176 | Average 3.23 |
| Argentineans | 47.4 /100 | #177 | Average 3.23 |
| Spaniards | 47.2 /100 | #178 | Average 3.23 |
| Immigrants | Korea | 46.9 /100 | #179 | Average 3.23 |
| Palestinians | 46.6 /100 | #180 | Average 3.23 |
| Spanish | 44.8 /100 | #181 | Average 3.23 |
| Moroccans | 44.2 /100 | #182 | Average 3.22 |
| Immigrants | Northern Africa | 41.7 /100 | #183 | Average 3.22 |
| Immigrants | Eastern Asia | 40.8 /100 | #184 | Average 3.22 |
| Immigrants | Sri Lanka | 39.8 /100 | #185 | Fair 3.22 |
| Immigrants | Argentina | 39.8 /100 | #186 | Fair 3.22 |
| Immigrants | Malaysia | 39.0 /100 | #187 | Fair 3.22 |
| Thais | 38.3 /100 | #188 | Fair 3.22 |
| Pakistanis | 33.7 /100 | #189 | Fair 3.22 |
| Burmese | 31.0 /100 | #190 | Fair 3.22 |
| Immigrants | Zaire | 30.5 /100 | #191 | Fair 3.22 |
| Immigrants | Eastern Africa | 30.1 /100 | #192 | Fair 3.22 |
| Immigrants | Israel | 29.3 /100 | #193 | Fair 3.22 |
| Immigrants | Sudan | 29.1 /100 | #194 | Fair 3.22 |