Bolivian vs Immigrants from Asia Currently Married
COMPARE
Bolivian
Immigrants from Asia
Currently Married
Currently Married Comparison
Bolivians
Immigrants from Asia
48.1%
CURRENTLY MARRIED
96.9/ 100
METRIC RATING
83rd/ 347
METRIC RANK
48.3%
CURRENTLY MARRIED
97.9/ 100
METRIC RATING
70th/ 347
METRIC RANK
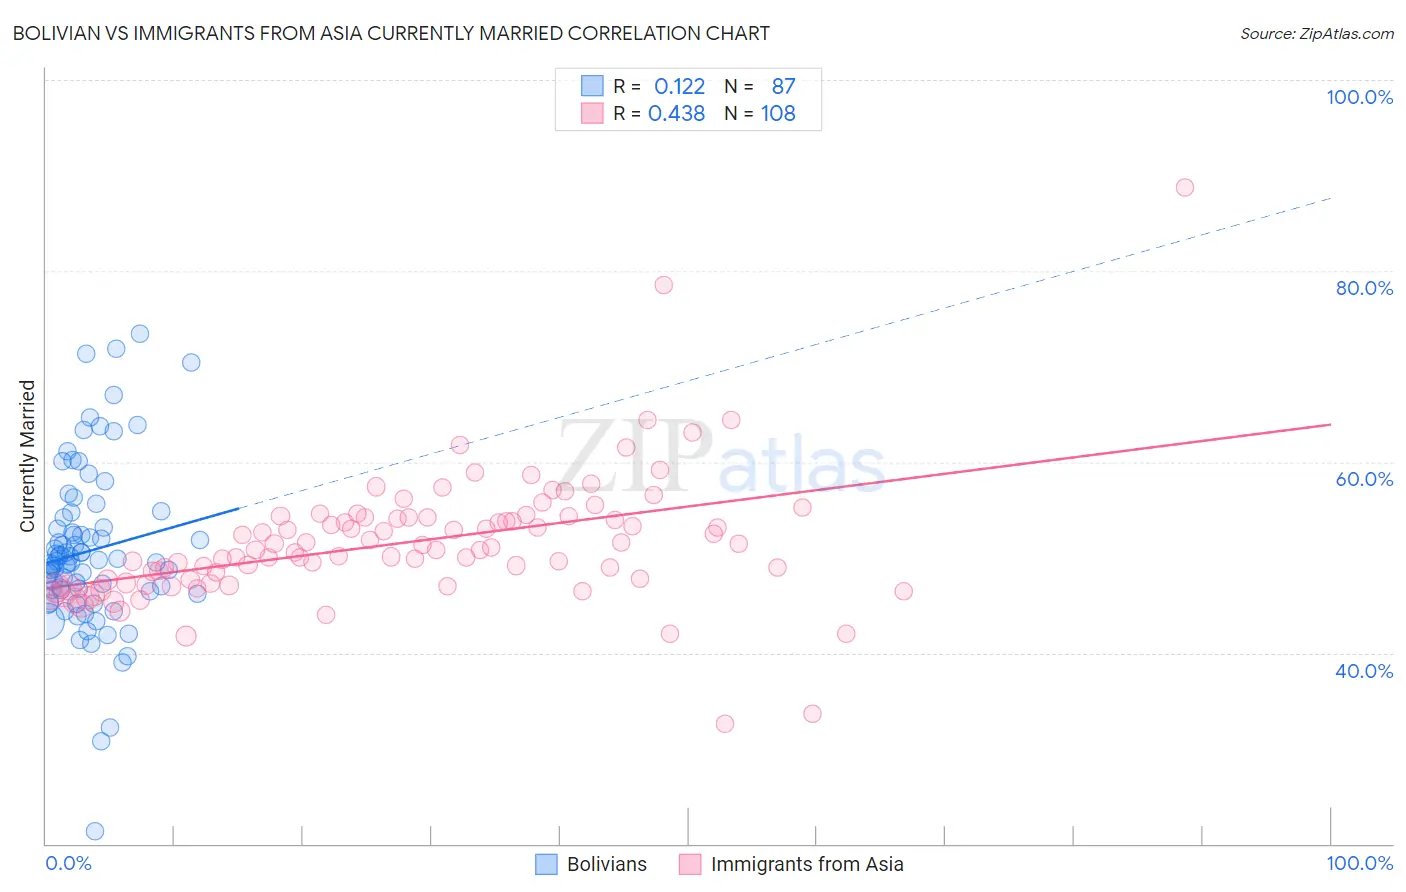
Bolivian vs Immigrants from Asia Currently Married Correlation Chart
The statistical analysis conducted on geographies consisting of 184,673,558 people shows a poor positive correlation between the proportion of Bolivians and percentage of population currently married in the United States with a correlation coefficient (R) of 0.122 and weighted average of 48.1%. Similarly, the statistical analysis conducted on geographies consisting of 549,041,877 people shows a moderate positive correlation between the proportion of Immigrants from Asia and percentage of population currently married in the United States with a correlation coefficient (R) of 0.438 and weighted average of 48.3%, a difference of 0.39%.
Currently Married Correlation Summary
| Measurement | Bolivian | Immigrants from Asia |
| Minimum | 21.3% | 32.6% |
| Maximum | 73.4% | 88.7% |
| Range | 52.1% | 56.1% |
| Mean | 50.7% | 51.6% |
| Median | 49.6% | 50.8% |
| Interquartile 25% (IQ1) | 46.4% | 47.5% |
| Interquartile 75% (IQ3) | 54.2% | 54.2% |
| Interquartile Range (IQR) | 7.8% | 6.7% |
| Standard Deviation (Sample) | 8.6% | 6.9% |
| Standard Deviation (Population) | 8.6% | 6.9% |
Demographics Similar to Bolivians and Immigrants from Asia by Currently Married
In terms of currently married, the demographic groups most similar to Bolivians are Immigrants from Israel (48.1%, a difference of 0.0%), Immigrants from Poland (48.1%, a difference of 0.010%), Immigrants from Sri Lanka (48.1%, a difference of 0.010%), Immigrants from Europe (48.1%, a difference of 0.010%), and Immigrants from South Africa (48.1%, a difference of 0.050%). Similarly, the demographic groups most similar to Immigrants from Asia are Macedonian (48.3%, a difference of 0.010%), Canadian (48.3%, a difference of 0.090%), Immigrants from England (48.3%, a difference of 0.10%), Slovak (48.3%, a difference of 0.11%), and Tongan (48.3%, a difference of 0.12%).
| Demographics | Rating | Rank | Currently Married |
| Tongans | 98.2 /100 | #66 | Exceptional 48.3% |
| Slovaks | 98.2 /100 | #67 | Exceptional 48.3% |
| Immigrants | England | 98.2 /100 | #68 | Exceptional 48.3% |
| Canadians | 98.1 /100 | #69 | Exceptional 48.3% |
| Immigrants | Asia | 97.9 /100 | #70 | Exceptional 48.3% |
| Macedonians | 97.9 /100 | #71 | Exceptional 48.3% |
| Immigrants | Lebanon | 97.6 /100 | #72 | Exceptional 48.2% |
| Immigrants | Eastern Asia | 97.5 /100 | #73 | Exceptional 48.2% |
| Estonians | 97.4 /100 | #74 | Exceptional 48.2% |
| Immigrants | Belarus | 97.2 /100 | #75 | Exceptional 48.1% |
| Basques | 97.2 /100 | #76 | Exceptional 48.1% |
| Slovenes | 97.1 /100 | #77 | Exceptional 48.1% |
| Immigrants | Belgium | 97.1 /100 | #78 | Exceptional 48.1% |
| Immigrants | South Africa | 97.0 /100 | #79 | Exceptional 48.1% |
| Immigrants | Poland | 96.9 /100 | #80 | Exceptional 48.1% |
| Immigrants | Sri Lanka | 96.9 /100 | #81 | Exceptional 48.1% |
| Immigrants | Europe | 96.9 /100 | #82 | Exceptional 48.1% |
| Bolivians | 96.9 /100 | #83 | Exceptional 48.1% |
| Immigrants | Israel | 96.9 /100 | #84 | Exceptional 48.1% |
| French Canadians | 96.3 /100 | #85 | Exceptional 48.0% |
| Immigrants | Japan | 96.2 /100 | #86 | Exceptional 48.0% |