Bolivian vs Immigrants from Middle Africa Currently Married
COMPARE
Bolivian
Immigrants from Middle Africa
Currently Married
Currently Married Comparison
Bolivians
Immigrants from Middle Africa
48.1%
CURRENTLY MARRIED
96.9/ 100
METRIC RATING
83rd/ 347
METRIC RANK
43.0%
CURRENTLY MARRIED
0.0/ 100
METRIC RATING
285th/ 347
METRIC RANK
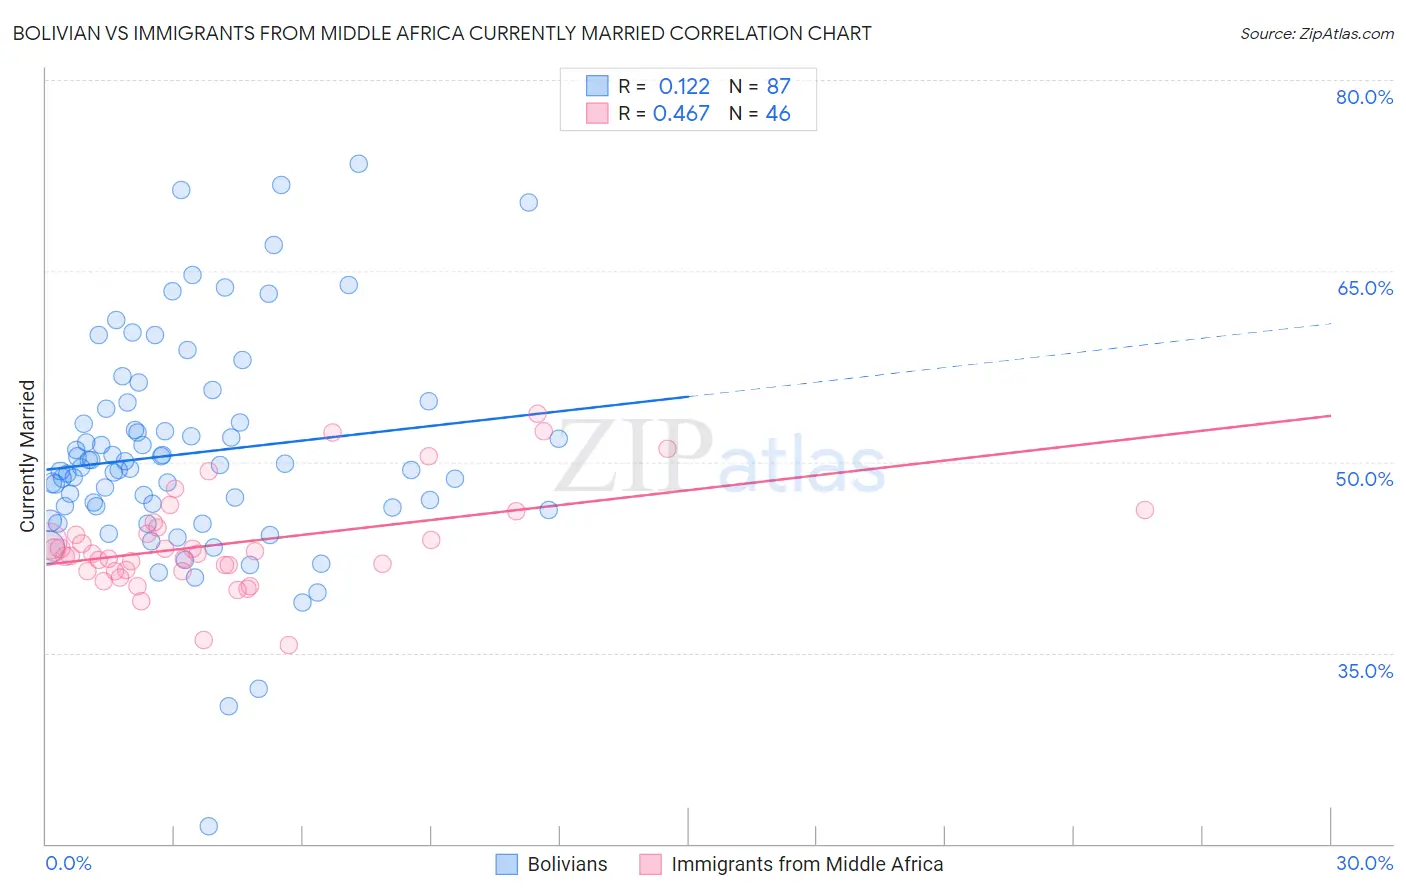
Bolivian vs Immigrants from Middle Africa Currently Married Correlation Chart
The statistical analysis conducted on geographies consisting of 184,673,558 people shows a poor positive correlation between the proportion of Bolivians and percentage of population currently married in the United States with a correlation coefficient (R) of 0.122 and weighted average of 48.1%. Similarly, the statistical analysis conducted on geographies consisting of 202,724,037 people shows a moderate positive correlation between the proportion of Immigrants from Middle Africa and percentage of population currently married in the United States with a correlation coefficient (R) of 0.467 and weighted average of 43.0%, a difference of 11.9%.
Currently Married Correlation Summary
| Measurement | Bolivian | Immigrants from Middle Africa |
| Minimum | 21.3% | 35.6% |
| Maximum | 73.4% | 53.8% |
| Range | 52.1% | 18.2% |
| Mean | 50.7% | 43.6% |
| Median | 49.6% | 42.8% |
| Interquartile 25% (IQ1) | 46.4% | 41.4% |
| Interquartile 75% (IQ3) | 54.2% | 44.8% |
| Interquartile Range (IQR) | 7.8% | 3.4% |
| Standard Deviation (Sample) | 8.6% | 3.9% |
| Standard Deviation (Population) | 8.6% | 3.8% |
Similar Demographics by Currently Married
Demographics Similar to Bolivians by Currently Married
In terms of currently married, the demographic groups most similar to Bolivians are Immigrants from Israel (48.1%, a difference of 0.0%), Immigrants from Poland (48.1%, a difference of 0.010%), Immigrants from Sri Lanka (48.1%, a difference of 0.010%), Immigrants from Europe (48.1%, a difference of 0.010%), and Immigrants from South Africa (48.1%, a difference of 0.050%).
| Demographics | Rating | Rank | Currently Married |
| Basques | 97.2 /100 | #76 | Exceptional 48.1% |
| Slovenes | 97.1 /100 | #77 | Exceptional 48.1% |
| Immigrants | Belgium | 97.1 /100 | #78 | Exceptional 48.1% |
| Immigrants | South Africa | 97.0 /100 | #79 | Exceptional 48.1% |
| Immigrants | Poland | 96.9 /100 | #80 | Exceptional 48.1% |
| Immigrants | Sri Lanka | 96.9 /100 | #81 | Exceptional 48.1% |
| Immigrants | Europe | 96.9 /100 | #82 | Exceptional 48.1% |
| Bolivians | 96.9 /100 | #83 | Exceptional 48.1% |
| Immigrants | Israel | 96.9 /100 | #84 | Exceptional 48.1% |
| French Canadians | 96.3 /100 | #85 | Exceptional 48.0% |
| Immigrants | Japan | 96.2 /100 | #86 | Exceptional 48.0% |
| Jordanians | 96.2 /100 | #87 | Exceptional 48.0% |
| Immigrants | Eastern Europe | 96.1 /100 | #88 | Exceptional 48.0% |
| Indians (Asian) | 95.8 /100 | #89 | Exceptional 48.0% |
| Americans | 95.7 /100 | #90 | Exceptional 48.0% |
Demographics Similar to Immigrants from Middle Africa by Currently Married
In terms of currently married, the demographic groups most similar to Immigrants from Middle Africa are Ghanaian (42.9%, a difference of 0.13%), Guatemalan (42.9%, a difference of 0.15%), Kiowa (43.2%, a difference of 0.40%), Immigrants from El Salvador (43.1%, a difference of 0.40%), and Native/Alaskan (42.8%, a difference of 0.42%).
| Demographics | Rating | Rank | Currently Married |
| Central Americans | 0.0 /100 | #278 | Tragic 43.3% |
| Central American Indians | 0.0 /100 | #279 | Tragic 43.3% |
| Apache | 0.0 /100 | #280 | Tragic 43.2% |
| Chippewa | 0.0 /100 | #281 | Tragic 43.2% |
| Immigrants | Ecuador | 0.0 /100 | #282 | Tragic 43.2% |
| Kiowa | 0.0 /100 | #283 | Tragic 43.2% |
| Immigrants | El Salvador | 0.0 /100 | #284 | Tragic 43.1% |
| Immigrants | Middle Africa | 0.0 /100 | #285 | Tragic 43.0% |
| Ghanaians | 0.0 /100 | #286 | Tragic 42.9% |
| Guatemalans | 0.0 /100 | #287 | Tragic 42.9% |
| Natives/Alaskans | 0.0 /100 | #288 | Tragic 42.8% |
| Paiute | 0.0 /100 | #289 | Tragic 42.7% |
| Immigrants | Ghana | 0.0 /100 | #290 | Tragic 42.7% |
| Immigrants | Guatemala | 0.0 /100 | #291 | Tragic 42.6% |
| Sub-Saharan Africans | 0.0 /100 | #292 | Tragic 42.6% |