Bolivian vs Immigrants from Indonesia Currently Married
COMPARE
Bolivian
Immigrants from Indonesia
Currently Married
Currently Married Comparison
Bolivians
Immigrants from Indonesia
48.1%
CURRENTLY MARRIED
96.9/ 100
METRIC RATING
83rd/ 347
METRIC RANK
47.6%
CURRENTLY MARRIED
90.5/ 100
METRIC RATING
115th/ 347
METRIC RANK
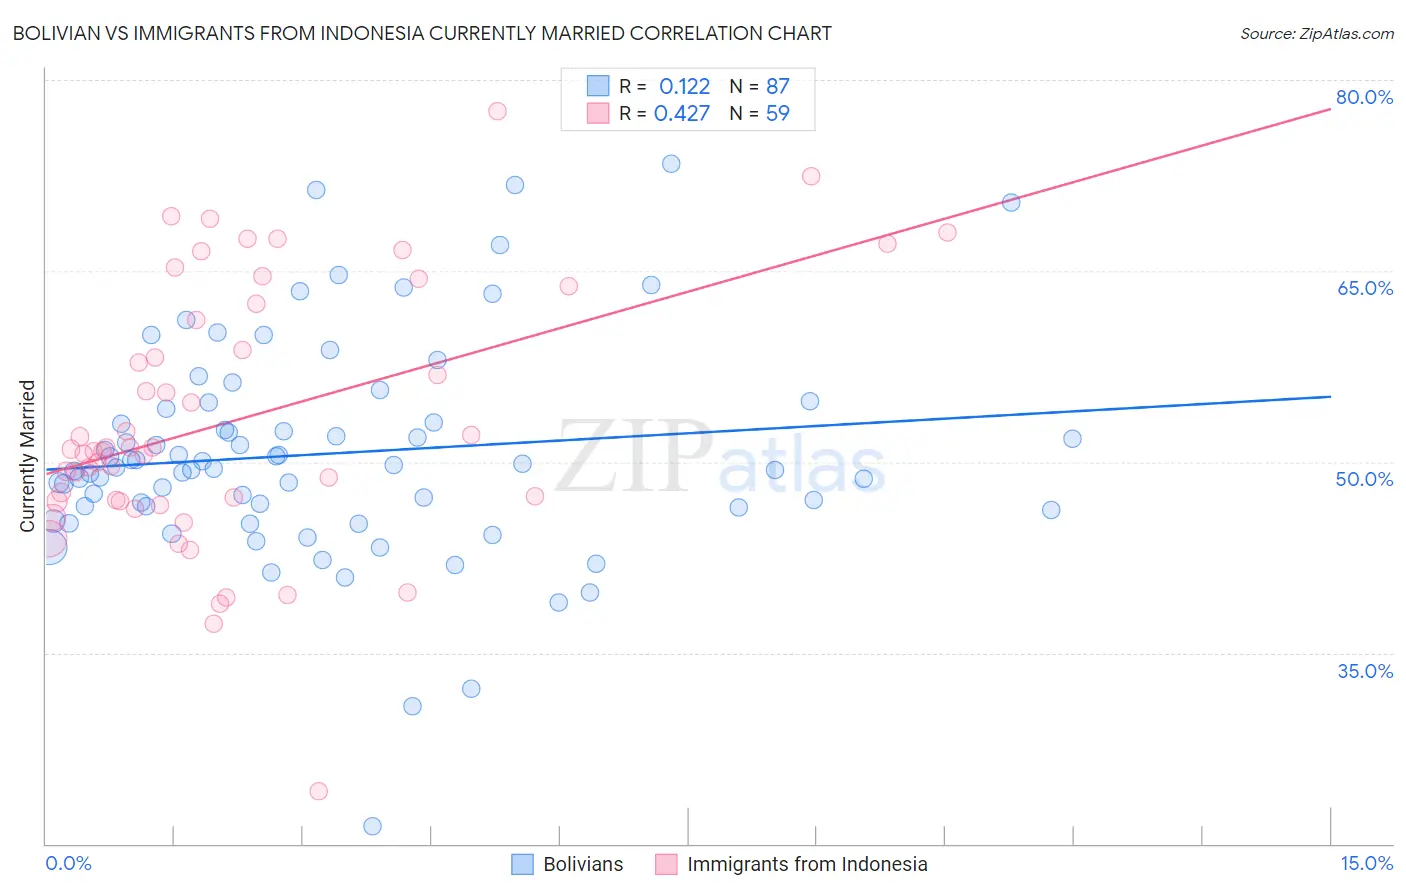
Bolivian vs Immigrants from Indonesia Currently Married Correlation Chart
The statistical analysis conducted on geographies consisting of 184,673,558 people shows a poor positive correlation between the proportion of Bolivians and percentage of population currently married in the United States with a correlation coefficient (R) of 0.122 and weighted average of 48.1%. Similarly, the statistical analysis conducted on geographies consisting of 215,768,024 people shows a moderate positive correlation between the proportion of Immigrants from Indonesia and percentage of population currently married in the United States with a correlation coefficient (R) of 0.427 and weighted average of 47.6%, a difference of 1.1%.
Currently Married Correlation Summary
| Measurement | Bolivian | Immigrants from Indonesia |
| Minimum | 21.3% | 24.1% |
| Maximum | 73.4% | 77.5% |
| Range | 52.1% | 53.4% |
| Mean | 50.7% | 53.3% |
| Median | 49.6% | 51.0% |
| Interquartile 25% (IQ1) | 46.4% | 46.9% |
| Interquartile 75% (IQ3) | 54.2% | 62.4% |
| Interquartile Range (IQR) | 7.8% | 15.5% |
| Standard Deviation (Sample) | 8.6% | 10.3% |
| Standard Deviation (Population) | 8.6% | 10.2% |
Similar Demographics by Currently Married
Demographics Similar to Bolivians by Currently Married
In terms of currently married, the demographic groups most similar to Bolivians are Immigrants from Israel (48.1%, a difference of 0.0%), Immigrants from Poland (48.1%, a difference of 0.010%), Immigrants from Sri Lanka (48.1%, a difference of 0.010%), Immigrants from Europe (48.1%, a difference of 0.010%), and Immigrants from South Africa (48.1%, a difference of 0.050%).
| Demographics | Rating | Rank | Currently Married |
| Basques | 97.2 /100 | #76 | Exceptional 48.1% |
| Slovenes | 97.1 /100 | #77 | Exceptional 48.1% |
| Immigrants | Belgium | 97.1 /100 | #78 | Exceptional 48.1% |
| Immigrants | South Africa | 97.0 /100 | #79 | Exceptional 48.1% |
| Immigrants | Poland | 96.9 /100 | #80 | Exceptional 48.1% |
| Immigrants | Sri Lanka | 96.9 /100 | #81 | Exceptional 48.1% |
| Immigrants | Europe | 96.9 /100 | #82 | Exceptional 48.1% |
| Bolivians | 96.9 /100 | #83 | Exceptional 48.1% |
| Immigrants | Israel | 96.9 /100 | #84 | Exceptional 48.1% |
| French Canadians | 96.3 /100 | #85 | Exceptional 48.0% |
| Immigrants | Japan | 96.2 /100 | #86 | Exceptional 48.0% |
| Jordanians | 96.2 /100 | #87 | Exceptional 48.0% |
| Immigrants | Eastern Europe | 96.1 /100 | #88 | Exceptional 48.0% |
| Indians (Asian) | 95.8 /100 | #89 | Exceptional 48.0% |
| Americans | 95.7 /100 | #90 | Exceptional 48.0% |
Demographics Similar to Immigrants from Indonesia by Currently Married
In terms of currently married, the demographic groups most similar to Immigrants from Indonesia are South African (47.6%, a difference of 0.0%), Palestinian (47.6%, a difference of 0.010%), Puget Sound Salish (47.6%, a difference of 0.020%), Immigrants from Philippines (47.6%, a difference of 0.030%), and Australian (47.6%, a difference of 0.030%).
| Demographics | Rating | Rank | Currently Married |
| Tsimshian | 92.4 /100 | #108 | Exceptional 47.7% |
| Immigrants | Egypt | 92.3 /100 | #109 | Exceptional 47.7% |
| Immigrants | Russia | 92.0 /100 | #110 | Exceptional 47.7% |
| Immigrants | Hungary | 91.2 /100 | #111 | Exceptional 47.6% |
| Immigrants | Western Europe | 91.1 /100 | #112 | Exceptional 47.6% |
| Immigrants | Denmark | 90.9 /100 | #113 | Exceptional 47.6% |
| South Africans | 90.5 /100 | #114 | Exceptional 47.6% |
| Immigrants | Indonesia | 90.5 /100 | #115 | Exceptional 47.6% |
| Palestinians | 90.4 /100 | #116 | Exceptional 47.6% |
| Puget Sound Salish | 90.3 /100 | #117 | Exceptional 47.6% |
| Immigrants | Philippines | 90.2 /100 | #118 | Exceptional 47.6% |
| Australians | 90.2 /100 | #119 | Exceptional 47.6% |
| Syrians | 88.9 /100 | #120 | Excellent 47.5% |
| Immigrants | Croatia | 88.6 /100 | #121 | Excellent 47.5% |
| Osage | 87.9 /100 | #122 | Excellent 47.5% |