Bolivian vs Immigrants from Uganda Currently Married
COMPARE
Bolivian
Immigrants from Uganda
Currently Married
Currently Married Comparison
Bolivians
Immigrants from Uganda
48.1%
CURRENTLY MARRIED
96.9/ 100
METRIC RATING
83rd/ 347
METRIC RANK
45.0%
CURRENTLY MARRIED
2.2/ 100
METRIC RATING
224th/ 347
METRIC RANK
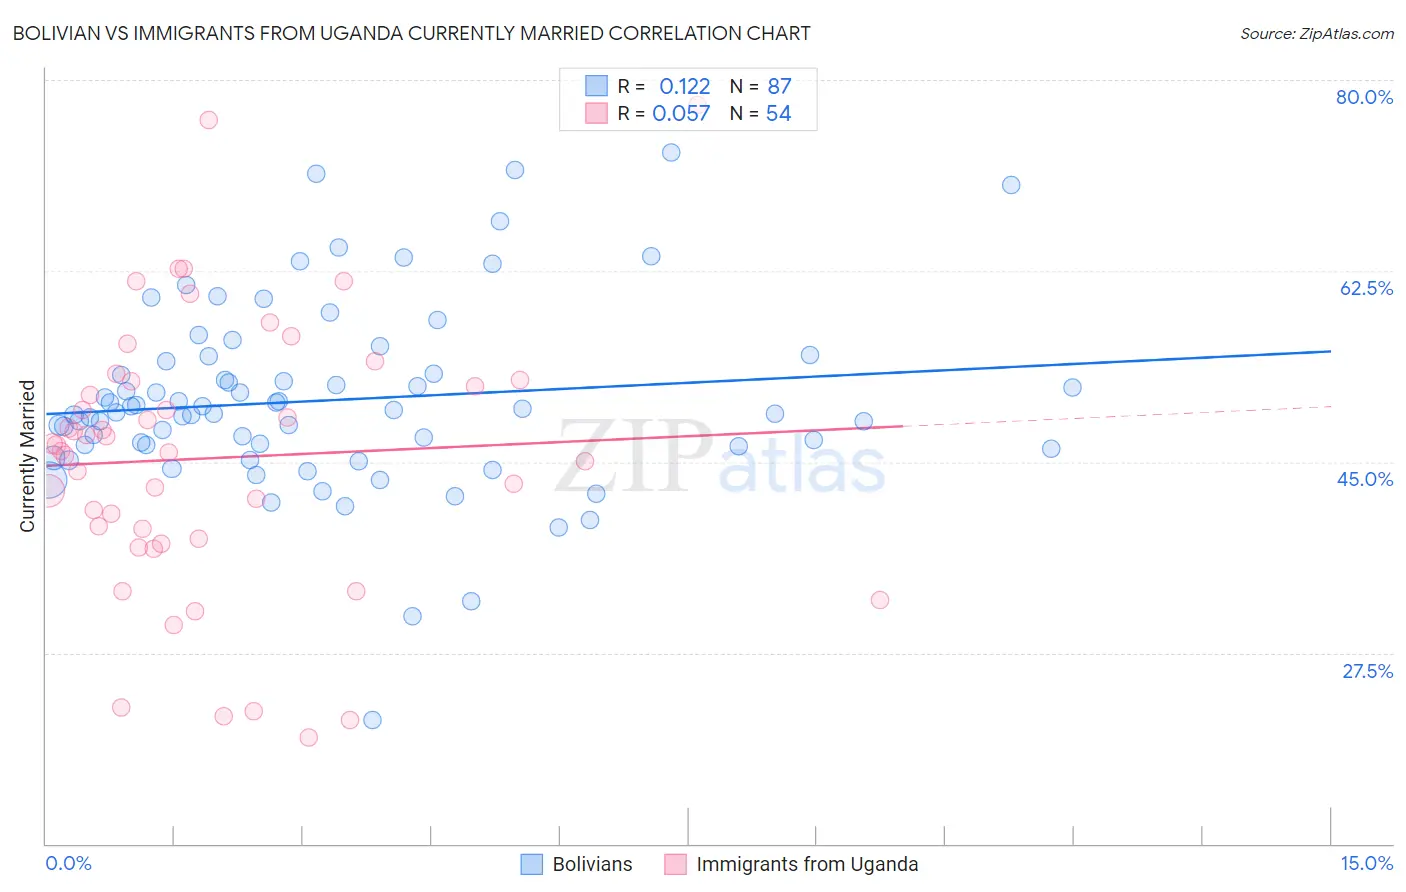
Bolivian vs Immigrants from Uganda Currently Married Correlation Chart
The statistical analysis conducted on geographies consisting of 184,673,558 people shows a poor positive correlation between the proportion of Bolivians and percentage of population currently married in the United States with a correlation coefficient (R) of 0.122 and weighted average of 48.1%. Similarly, the statistical analysis conducted on geographies consisting of 125,979,600 people shows a slight positive correlation between the proportion of Immigrants from Uganda and percentage of population currently married in the United States with a correlation coefficient (R) of 0.057 and weighted average of 45.0%, a difference of 6.9%.
Currently Married Correlation Summary
| Measurement | Bolivian | Immigrants from Uganda |
| Minimum | 21.3% | 19.7% |
| Maximum | 73.4% | 77.7% |
| Range | 52.1% | 58.0% |
| Mean | 50.7% | 45.4% |
| Median | 49.6% | 46.2% |
| Interquartile 25% (IQ1) | 46.4% | 38.0% |
| Interquartile 75% (IQ3) | 54.2% | 52.4% |
| Interquartile Range (IQR) | 7.8% | 14.5% |
| Standard Deviation (Sample) | 8.6% | 12.5% |
| Standard Deviation (Population) | 8.6% | 12.4% |
Similar Demographics by Currently Married
Demographics Similar to Bolivians by Currently Married
In terms of currently married, the demographic groups most similar to Bolivians are Immigrants from Israel (48.1%, a difference of 0.0%), Immigrants from Poland (48.1%, a difference of 0.010%), Immigrants from Sri Lanka (48.1%, a difference of 0.010%), Immigrants from Europe (48.1%, a difference of 0.010%), and Immigrants from South Africa (48.1%, a difference of 0.050%).
| Demographics | Rating | Rank | Currently Married |
| Basques | 97.2 /100 | #76 | Exceptional 48.1% |
| Slovenes | 97.1 /100 | #77 | Exceptional 48.1% |
| Immigrants | Belgium | 97.1 /100 | #78 | Exceptional 48.1% |
| Immigrants | South Africa | 97.0 /100 | #79 | Exceptional 48.1% |
| Immigrants | Poland | 96.9 /100 | #80 | Exceptional 48.1% |
| Immigrants | Sri Lanka | 96.9 /100 | #81 | Exceptional 48.1% |
| Immigrants | Europe | 96.9 /100 | #82 | Exceptional 48.1% |
| Bolivians | 96.9 /100 | #83 | Exceptional 48.1% |
| Immigrants | Israel | 96.9 /100 | #84 | Exceptional 48.1% |
| French Canadians | 96.3 /100 | #85 | Exceptional 48.0% |
| Immigrants | Japan | 96.2 /100 | #86 | Exceptional 48.0% |
| Jordanians | 96.2 /100 | #87 | Exceptional 48.0% |
| Immigrants | Eastern Europe | 96.1 /100 | #88 | Exceptional 48.0% |
| Indians (Asian) | 95.8 /100 | #89 | Exceptional 48.0% |
| Americans | 95.7 /100 | #90 | Exceptional 48.0% |
Demographics Similar to Immigrants from Uganda by Currently Married
In terms of currently married, the demographic groups most similar to Immigrants from Uganda are French American Indian (45.0%, a difference of 0.0%), Immigrants from Laos (45.0%, a difference of 0.050%), Comanche (45.0%, a difference of 0.050%), Spanish American (45.0%, a difference of 0.060%), and Immigrants from Uruguay (45.0%, a difference of 0.060%).
| Demographics | Rating | Rank | Currently Married |
| Immigrants | Thailand | 5.1 /100 | #217 | Tragic 45.4% |
| Panamanians | 4.0 /100 | #218 | Tragic 45.3% |
| Immigrants | Portugal | 3.5 /100 | #219 | Tragic 45.2% |
| Kenyans | 3.1 /100 | #220 | Tragic 45.2% |
| Mexicans | 3.0 /100 | #221 | Tragic 45.2% |
| Immigrants | Azores | 2.5 /100 | #222 | Tragic 45.1% |
| Immigrants | Laos | 2.3 /100 | #223 | Tragic 45.0% |
| Immigrants | Uganda | 2.2 /100 | #224 | Tragic 45.0% |
| French American Indians | 2.2 /100 | #225 | Tragic 45.0% |
| Comanche | 2.1 /100 | #226 | Tragic 45.0% |
| Spanish Americans | 2.1 /100 | #227 | Tragic 45.0% |
| Immigrants | Uruguay | 2.0 /100 | #228 | Tragic 45.0% |
| Cree | 1.7 /100 | #229 | Tragic 44.9% |
| Immigrants | Kenya | 1.6 /100 | #230 | Tragic 44.9% |
| Immigrants | Panama | 1.5 /100 | #231 | Tragic 44.9% |