Blackfeet vs Scandinavian Family Households with Children
COMPARE
Blackfeet
Scandinavian
Family Households with Children
Family Households with Children Comparison
Blackfeet
Scandinavians
27.5%
FAMILY HOUSEHOLDS WITH CHILDREN
54.3/ 100
METRIC RATING
171st/ 347
METRIC RANK
28.0%
FAMILY HOUSEHOLDS WITH CHILDREN
97.1/ 100
METRIC RATING
111th/ 347
METRIC RANK
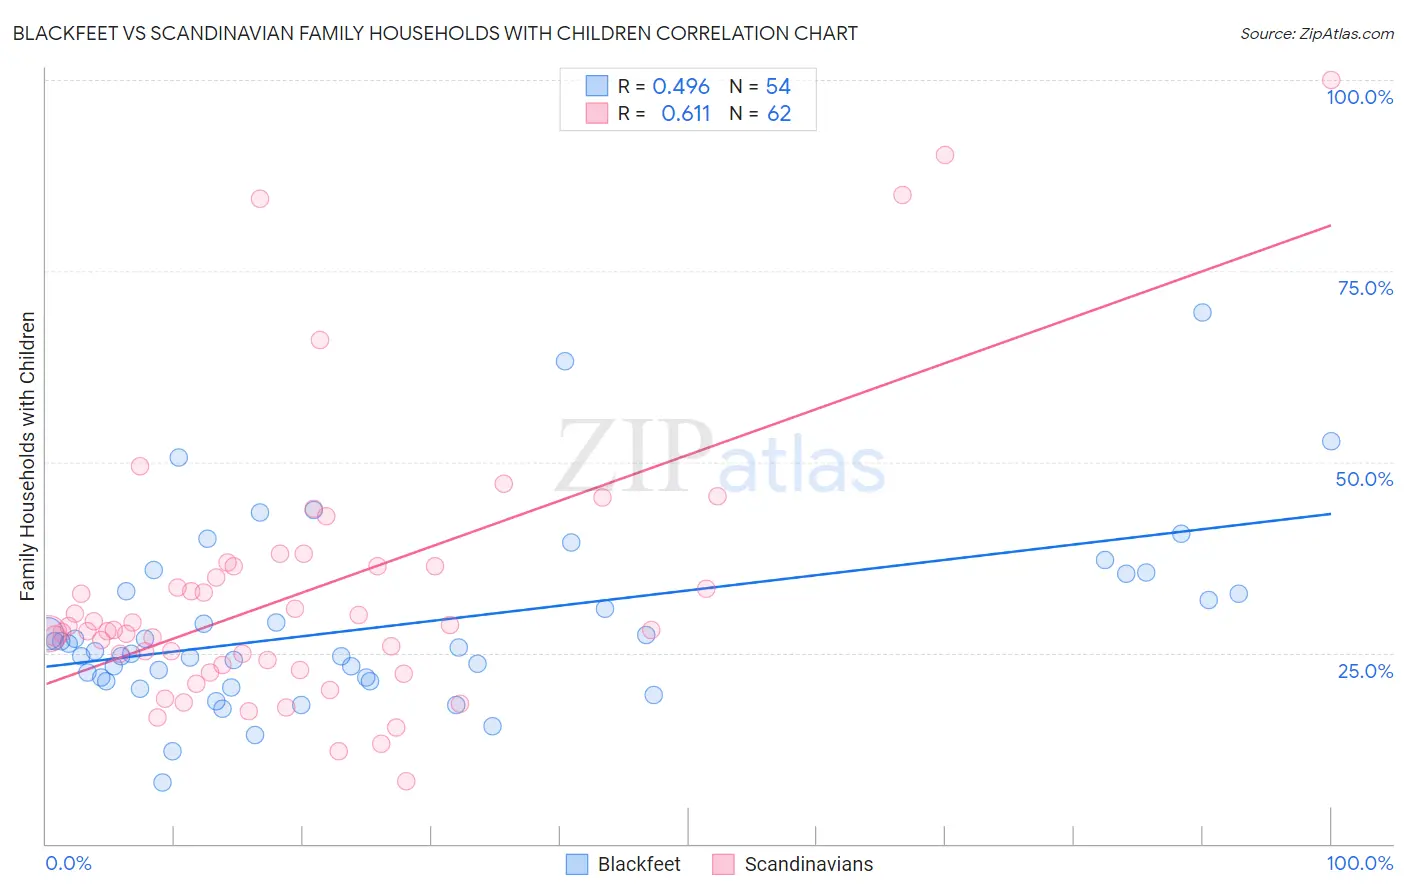
Blackfeet vs Scandinavian Family Households with Children Correlation Chart
The statistical analysis conducted on geographies consisting of 309,442,274 people shows a moderate positive correlation between the proportion of Blackfeet and percentage of family households with children in the United States with a correlation coefficient (R) of 0.496 and weighted average of 27.5%. Similarly, the statistical analysis conducted on geographies consisting of 472,042,007 people shows a significant positive correlation between the proportion of Scandinavians and percentage of family households with children in the United States with a correlation coefficient (R) of 0.611 and weighted average of 28.0%, a difference of 1.8%.
Family Households with Children Correlation Summary
| Measurement | Blackfeet | Scandinavian |
| Minimum | 8.0% | 8.1% |
| Maximum | 69.5% | 100.0% |
| Range | 61.5% | 91.9% |
| Mean | 28.6% | 32.9% |
| Median | 25.4% | 28.0% |
| Interquartile 25% (IQ1) | 21.7% | 23.4% |
| Interquartile 75% (IQ3) | 33.1% | 36.4% |
| Interquartile Range (IQR) | 11.4% | 13.0% |
| Standard Deviation (Sample) | 11.7% | 18.1% |
| Standard Deviation (Population) | 11.6% | 17.9% |
Similar Demographics by Family Households with Children
Demographics Similar to Blackfeet by Family Households with Children
In terms of family households with children, the demographic groups most similar to Blackfeet are Israeli (27.5%, a difference of 0.010%), Cherokee (27.5%, a difference of 0.050%), Immigrants from Argentina (27.5%, a difference of 0.050%), Seminole (27.5%, a difference of 0.060%), and White/Caucasian (27.4%, a difference of 0.090%).
| Demographics | Rating | Rank | Family Households with Children |
| Immigrants | Hong Kong | 64.9 /100 | #164 | Good 27.5% |
| Immigrants | South Africa | 61.3 /100 | #165 | Good 27.5% |
| Immigrants | Nonimmigrants | 61.2 /100 | #166 | Good 27.5% |
| Dominicans | 61.1 /100 | #167 | Good 27.5% |
| Immigrants | Kuwait | 60.9 /100 | #168 | Good 27.5% |
| Seminole | 56.9 /100 | #169 | Average 27.5% |
| Cherokee | 56.7 /100 | #170 | Average 27.5% |
| Blackfeet | 54.3 /100 | #171 | Average 27.5% |
| Israelis | 53.9 /100 | #172 | Average 27.5% |
| Immigrants | Argentina | 52.2 /100 | #173 | Average 27.5% |
| Whites/Caucasians | 50.0 /100 | #174 | Average 27.4% |
| British | 49.9 /100 | #175 | Average 27.4% |
| Immigrants | China | 49.6 /100 | #176 | Average 27.4% |
| Ugandans | 49.2 /100 | #177 | Average 27.4% |
| Spanish Americans | 48.9 /100 | #178 | Average 27.4% |
Demographics Similar to Scandinavians by Family Households with Children
In terms of family households with children, the demographic groups most similar to Scandinavians are Immigrants from Middle Africa (28.0%, a difference of 0.030%), Arab (28.0%, a difference of 0.030%), South American Indian (28.0%, a difference of 0.050%), Spaniard (28.0%, a difference of 0.060%), and Immigrants from Africa (28.0%, a difference of 0.060%).
| Demographics | Rating | Rank | Family Households with Children |
| Sioux | 98.3 /100 | #104 | Exceptional 28.1% |
| Choctaw | 98.3 /100 | #105 | Exceptional 28.1% |
| Immigrants | South America | 98.0 /100 | #106 | Exceptional 28.0% |
| Immigrants | Uganda | 97.7 /100 | #107 | Exceptional 28.0% |
| Immigrants | Burma/Myanmar | 97.7 /100 | #108 | Exceptional 28.0% |
| Tohono O'odham | 97.6 /100 | #109 | Exceptional 28.0% |
| Spaniards | 97.4 /100 | #110 | Exceptional 28.0% |
| Scandinavians | 97.1 /100 | #111 | Exceptional 28.0% |
| Immigrants | Middle Africa | 97.0 /100 | #112 | Exceptional 28.0% |
| Arabs | 97.0 /100 | #113 | Exceptional 28.0% |
| South American Indians | 96.9 /100 | #114 | Exceptional 28.0% |
| Immigrants | Africa | 96.8 /100 | #115 | Exceptional 28.0% |
| Pakistanis | 96.0 /100 | #116 | Exceptional 27.9% |
| Immigrants | Malaysia | 95.9 /100 | #117 | Exceptional 27.9% |
| Central American Indians | 95.9 /100 | #118 | Exceptional 27.9% |