Scandinavian vs Iranian Divorced or Separated
COMPARE
Scandinavian
Iranian
Divorced or Separated
Divorced or Separated Comparison
Scandinavians
Iranians
12.3%
DIVORCED OR SEPARATED
10.4/ 100
METRIC RATING
223rd/ 347
METRIC RANK
10.8%
DIVORCED OR SEPARATED
100.0/ 100
METRIC RATING
25th/ 347
METRIC RANK
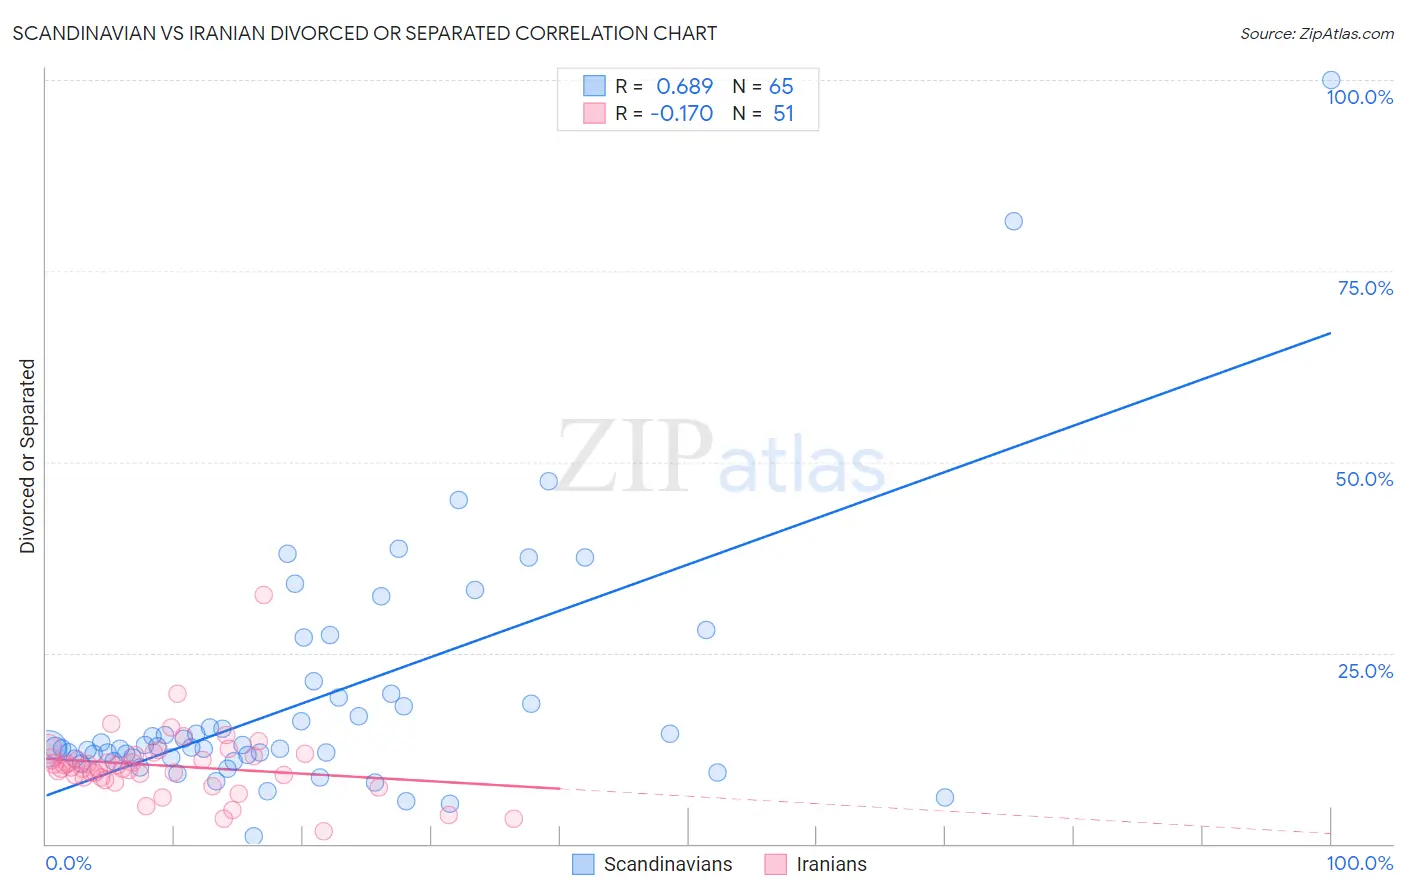
Scandinavian vs Iranian Divorced or Separated Correlation Chart
The statistical analysis conducted on geographies consisting of 472,421,001 people shows a significant positive correlation between the proportion of Scandinavians and percentage of population currently divorced or separated in the United States with a correlation coefficient (R) of 0.689 and weighted average of 12.3%. Similarly, the statistical analysis conducted on geographies consisting of 316,734,230 people shows a poor negative correlation between the proportion of Iranians and percentage of population currently divorced or separated in the United States with a correlation coefficient (R) of -0.170 and weighted average of 10.8%, a difference of 13.7%.
Divorced or Separated Correlation Summary
| Measurement | Scandinavian | Iranian |
| Minimum | 1.0% | 1.7% |
| Maximum | 100.0% | 32.5% |
| Range | 99.0% | 30.8% |
| Mean | 18.9% | 10.2% |
| Median | 12.6% | 9.9% |
| Interquartile 25% (IQ1) | 11.2% | 8.6% |
| Interquartile 75% (IQ3) | 19.4% | 11.6% |
| Interquartile Range (IQR) | 8.2% | 2.9% |
| Standard Deviation (Sample) | 16.4% | 4.6% |
| Standard Deviation (Population) | 16.3% | 4.5% |
Similar Demographics by Divorced or Separated
Demographics Similar to Scandinavians by Divorced or Separated
In terms of divorced or separated, the demographic groups most similar to Scandinavians are Bangladeshi (12.3%, a difference of 0.010%), Immigrants from the Azores (12.3%, a difference of 0.070%), Belgian (12.3%, a difference of 0.070%), Guamanian/Chamorro (12.3%, a difference of 0.080%), and Immigrants from Western Africa (12.3%, a difference of 0.10%).
| Demographics | Rating | Rank | Divorced or Separated |
| Immigrants | South America | 15.4 /100 | #216 | Poor 12.2% |
| Northern Europeans | 14.7 /100 | #217 | Poor 12.2% |
| Slovenes | 13.2 /100 | #218 | Poor 12.3% |
| Czechoslovakians | 11.7 /100 | #219 | Poor 12.3% |
| British | 11.6 /100 | #220 | Poor 12.3% |
| Guamanians/Chamorros | 11.3 /100 | #221 | Poor 12.3% |
| Bangladeshis | 10.5 /100 | #222 | Poor 12.3% |
| Scandinavians | 10.4 /100 | #223 | Poor 12.3% |
| Immigrants | Azores | 9.7 /100 | #224 | Tragic 12.3% |
| Belgians | 9.7 /100 | #225 | Tragic 12.3% |
| Immigrants | Western Africa | 9.3 /100 | #226 | Tragic 12.3% |
| Hmong | 8.8 /100 | #227 | Tragic 12.3% |
| Immigrants | Cameroon | 8.3 /100 | #228 | Tragic 12.3% |
| Immigrants | Sudan | 8.2 /100 | #229 | Tragic 12.3% |
| Yakama | 7.8 /100 | #230 | Tragic 12.3% |
Demographics Similar to Iranians by Divorced or Separated
In terms of divorced or separated, the demographic groups most similar to Iranians are Immigrants from Sri Lanka (10.8%, a difference of 0.050%), Immigrants from Pakistan (10.8%, a difference of 0.24%), Vietnamese (10.8%, a difference of 0.42%), Immigrants from Asia (10.7%, a difference of 0.68%), and Burmese (10.7%, a difference of 0.86%).
| Demographics | Rating | Rank | Divorced or Separated |
| Immigrants | Iran | 100.0 /100 | #18 | Exceptional 10.6% |
| Asians | 100.0 /100 | #19 | Exceptional 10.6% |
| Burmese | 100.0 /100 | #20 | Exceptional 10.7% |
| Immigrants | Asia | 100.0 /100 | #21 | Exceptional 10.7% |
| Vietnamese | 100.0 /100 | #22 | Exceptional 10.8% |
| Immigrants | Pakistan | 100.0 /100 | #23 | Exceptional 10.8% |
| Immigrants | Sri Lanka | 100.0 /100 | #24 | Exceptional 10.8% |
| Iranians | 100.0 /100 | #25 | Exceptional 10.8% |
| Immigrants | Indonesia | 100.0 /100 | #26 | Exceptional 10.9% |
| Immigrants | Bangladesh | 100.0 /100 | #27 | Exceptional 11.0% |
| Immigrants | Malaysia | 100.0 /100 | #28 | Exceptional 11.0% |
| Armenians | 100.0 /100 | #29 | Exceptional 11.0% |
| Immigrants | Ireland | 100.0 /100 | #30 | Exceptional 11.0% |
| Mongolians | 100.0 /100 | #31 | Exceptional 11.1% |
| Tongans | 100.0 /100 | #32 | Exceptional 11.1% |