Black/African American vs Alaska Native Average Family Size
COMPARE
Black/African American
Alaska Native
Average Family Size
Average Family Size Comparison
Blacks/African Americans
Alaska Natives
3.27
AVERAGE FAMILY SIZE
95.7/ 100
METRIC RATING
112th/ 347
METRIC RANK
3.37
AVERAGE FAMILY SIZE
100.0/ 100
METRIC RATING
44th/ 347
METRIC RANK
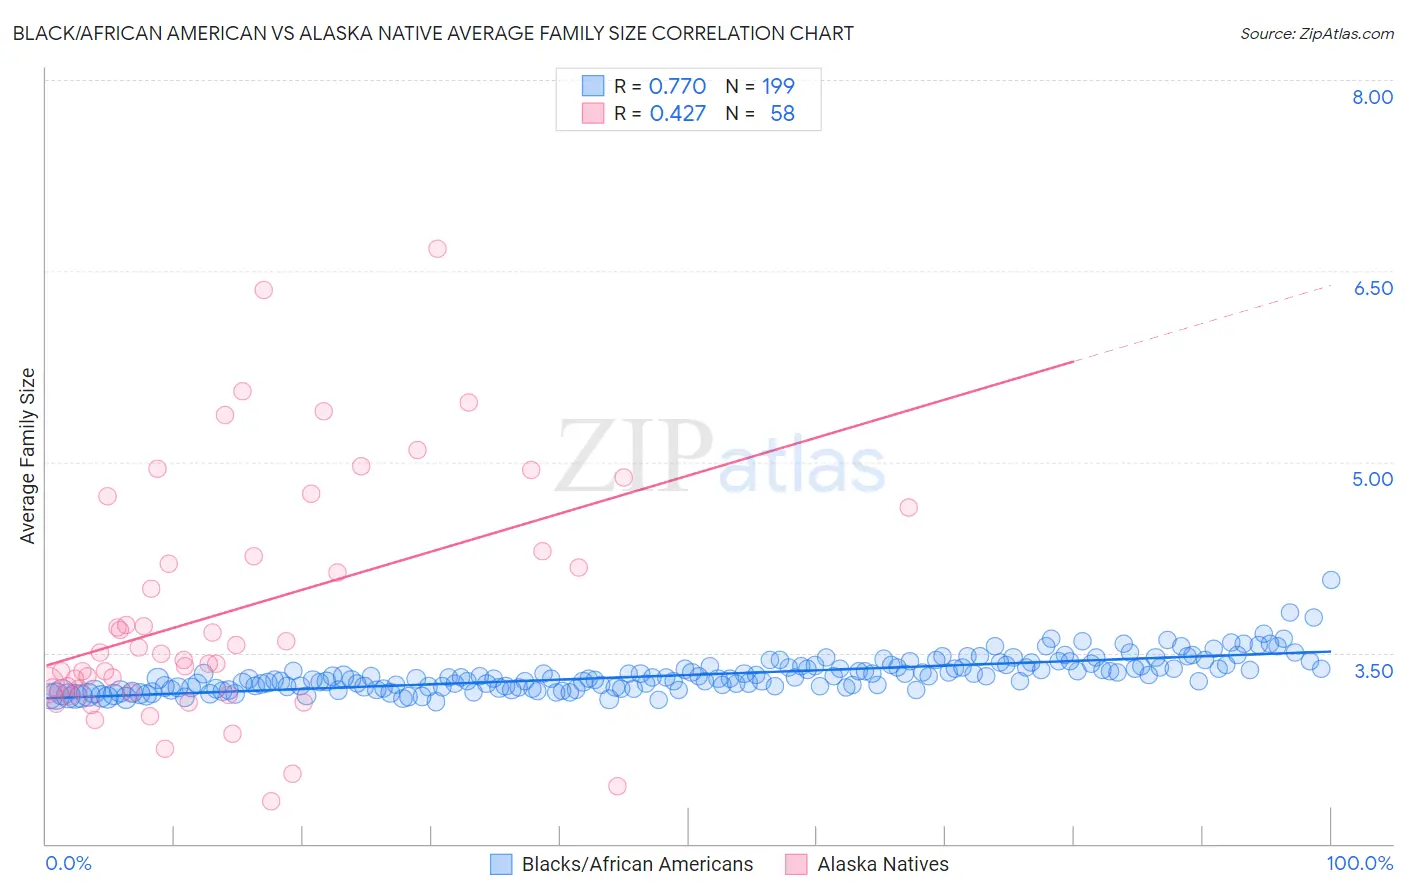
Black/African American vs Alaska Native Average Family Size Correlation Chart
The statistical analysis conducted on geographies consisting of 565,344,221 people shows a strong positive correlation between the proportion of Blacks/African Americans and average family size in the United States with a correlation coefficient (R) of 0.770 and weighted average of 3.27. Similarly, the statistical analysis conducted on geographies consisting of 76,756,389 people shows a moderate positive correlation between the proportion of Alaska Natives and average family size in the United States with a correlation coefficient (R) of 0.427 and weighted average of 3.37, a difference of 3.1%.
Average Family Size Correlation Summary
| Measurement | Black/African American | Alaska Native |
| Minimum | 3.12 | 2.33 |
| Maximum | 4.08 | 6.67 |
| Range | 0.96 | 4.34 |
| Mean | 3.33 | 3.83 |
| Median | 3.30 | 3.50 |
| Interquartile 25% (IQ1) | 3.23 | 3.22 |
| Interquartile 75% (IQ3) | 3.39 | 4.30 |
| Interquartile Range (IQR) | 0.16 | 1.08 |
| Standard Deviation (Sample) | 0.14 | 0.95 |
| Standard Deviation (Population) | 0.14 | 0.94 |
Similar Demographics by Average Family Size
Demographics Similar to Blacks/African Americans by Average Family Size
In terms of average family size, the demographic groups most similar to Blacks/African Americans are Immigrants from Panama (3.27, a difference of 0.010%), Indonesian (3.28, a difference of 0.060%), South American (3.27, a difference of 0.060%), Immigrants from Liberia (3.27, a difference of 0.070%), and Immigrants from South America (3.27, a difference of 0.070%).
| Demographics | Rating | Rank | Average Family Size |
| Immigrants | Ghana | 98.1 /100 | #105 | Exceptional 3.29 |
| Paiute | 98.0 /100 | #106 | Exceptional 3.29 |
| Ghanaians | 98.0 /100 | #107 | Exceptional 3.29 |
| Asians | 97.0 /100 | #108 | Exceptional 3.28 |
| Puerto Ricans | 96.7 /100 | #109 | Exceptional 3.28 |
| Bahamians | 96.6 /100 | #110 | Exceptional 3.28 |
| Indonesians | 96.2 /100 | #111 | Exceptional 3.28 |
| Blacks/African Americans | 95.7 /100 | #112 | Exceptional 3.27 |
| Immigrants | Panama | 95.6 /100 | #113 | Exceptional 3.27 |
| South Americans | 95.1 /100 | #114 | Exceptional 3.27 |
| Immigrants | Liberia | 95.0 /100 | #115 | Exceptional 3.27 |
| Immigrants | South America | 95.0 /100 | #116 | Exceptional 3.27 |
| Kiowa | 94.8 /100 | #117 | Exceptional 3.27 |
| Immigrants | Asia | 94.0 /100 | #118 | Exceptional 3.27 |
| Immigrants | Indonesia | 93.7 /100 | #119 | Exceptional 3.27 |
Demographics Similar to Alaska Natives by Average Family Size
In terms of average family size, the demographic groups most similar to Alaska Natives are Immigrants from Philippines (3.37, a difference of 0.010%), Shoshone (3.37, a difference of 0.030%), Haitian (3.37, a difference of 0.090%), Immigrants from Vietnam (3.38, a difference of 0.11%), and Vietnamese (3.37, a difference of 0.13%).
| Demographics | Rating | Rank | Average Family Size |
| Guyanese | 100.0 /100 | #37 | Exceptional 3.40 |
| Immigrants | Belize | 100.0 /100 | #38 | Exceptional 3.39 |
| Immigrants | Haiti | 100.0 /100 | #39 | Exceptional 3.39 |
| Belizeans | 100.0 /100 | #40 | Exceptional 3.39 |
| Marshallese | 100.0 /100 | #41 | Exceptional 3.38 |
| Immigrants | Vietnam | 100.0 /100 | #42 | Exceptional 3.38 |
| Immigrants | Philippines | 100.0 /100 | #43 | Exceptional 3.37 |
| Alaska Natives | 100.0 /100 | #44 | Exceptional 3.37 |
| Shoshone | 100.0 /100 | #45 | Exceptional 3.37 |
| Haitians | 100.0 /100 | #46 | Exceptional 3.37 |
| Vietnamese | 100.0 /100 | #47 | Exceptional 3.37 |
| Immigrants | Nicaragua | 100.0 /100 | #48 | Exceptional 3.37 |
| Bangladeshis | 100.0 /100 | #49 | Exceptional 3.37 |
| Immigrants | Bangladesh | 100.0 /100 | #50 | Exceptional 3.36 |
| Nicaraguans | 100.0 /100 | #51 | Exceptional 3.36 |