Black/African American vs Slovene Average Family Size
COMPARE
Black/African American
Slovene
Average Family Size
Average Family Size Comparison
Blacks/African Americans
Slovenes
3.27
AVERAGE FAMILY SIZE
95.7/ 100
METRIC RATING
112th/ 347
METRIC RANK
3.07
AVERAGE FAMILY SIZE
0.0/ 100
METRIC RATING
345th/ 347
METRIC RANK
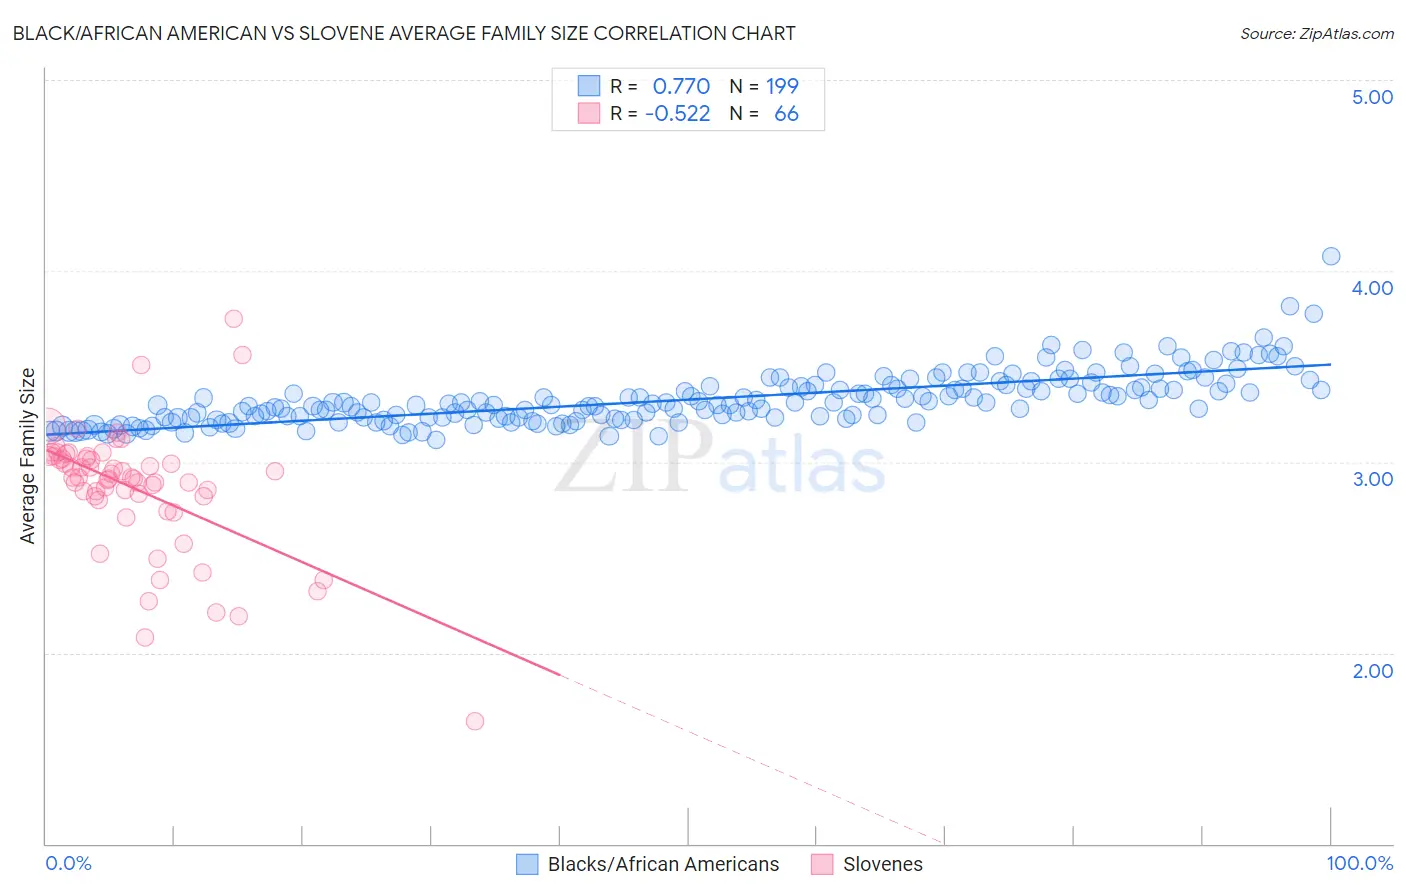
Black/African American vs Slovene Average Family Size Correlation Chart
The statistical analysis conducted on geographies consisting of 565,344,221 people shows a strong positive correlation between the proportion of Blacks/African Americans and average family size in the United States with a correlation coefficient (R) of 0.770 and weighted average of 3.27. Similarly, the statistical analysis conducted on geographies consisting of 261,257,003 people shows a substantial negative correlation between the proportion of Slovenes and average family size in the United States with a correlation coefficient (R) of -0.522 and weighted average of 3.07, a difference of 6.5%.
Average Family Size Correlation Summary
| Measurement | Black/African American | Slovene |
| Minimum | 3.12 | 1.64 |
| Maximum | 4.08 | 3.75 |
| Range | 0.96 | 2.11 |
| Mean | 3.33 | 2.86 |
| Median | 3.30 | 2.92 |
| Interquartile 25% (IQ1) | 3.23 | 2.82 |
| Interquartile 75% (IQ3) | 3.39 | 3.03 |
| Interquartile Range (IQR) | 0.16 | 0.21 |
| Standard Deviation (Sample) | 0.14 | 0.34 |
| Standard Deviation (Population) | 0.14 | 0.33 |
Similar Demographics by Average Family Size
Demographics Similar to Blacks/African Americans by Average Family Size
In terms of average family size, the demographic groups most similar to Blacks/African Americans are Immigrants from Panama (3.27, a difference of 0.010%), Indonesian (3.28, a difference of 0.060%), South American (3.27, a difference of 0.060%), Immigrants from Liberia (3.27, a difference of 0.070%), and Immigrants from South America (3.27, a difference of 0.070%).
| Demographics | Rating | Rank | Average Family Size |
| Immigrants | Ghana | 98.1 /100 | #105 | Exceptional 3.29 |
| Paiute | 98.0 /100 | #106 | Exceptional 3.29 |
| Ghanaians | 98.0 /100 | #107 | Exceptional 3.29 |
| Asians | 97.0 /100 | #108 | Exceptional 3.28 |
| Puerto Ricans | 96.7 /100 | #109 | Exceptional 3.28 |
| Bahamians | 96.6 /100 | #110 | Exceptional 3.28 |
| Indonesians | 96.2 /100 | #111 | Exceptional 3.28 |
| Blacks/African Americans | 95.7 /100 | #112 | Exceptional 3.27 |
| Immigrants | Panama | 95.6 /100 | #113 | Exceptional 3.27 |
| South Americans | 95.1 /100 | #114 | Exceptional 3.27 |
| Immigrants | Liberia | 95.0 /100 | #115 | Exceptional 3.27 |
| Immigrants | South America | 95.0 /100 | #116 | Exceptional 3.27 |
| Kiowa | 94.8 /100 | #117 | Exceptional 3.27 |
| Immigrants | Asia | 94.0 /100 | #118 | Exceptional 3.27 |
| Immigrants | Indonesia | 93.7 /100 | #119 | Exceptional 3.27 |
Demographics Similar to Slovenes by Average Family Size
In terms of average family size, the demographic groups most similar to Slovenes are French Canadian (3.07, a difference of 0.040%), Norwegian (3.08, a difference of 0.28%), Slovak (3.06, a difference of 0.29%), Carpatho Rusyn (3.06, a difference of 0.35%), and German (3.09, a difference of 0.51%).
| Demographics | Rating | Rank | Average Family Size |
| Estonians | 0.0 /100 | #333 | Tragic 3.10 |
| Lithuanians | 0.0 /100 | #334 | Tragic 3.10 |
| Luxembourgers | 0.0 /100 | #335 | Tragic 3.10 |
| Irish | 0.0 /100 | #336 | Tragic 3.10 |
| Swedes | 0.0 /100 | #337 | Tragic 3.10 |
| French | 0.0 /100 | #338 | Tragic 3.10 |
| Croatians | 0.0 /100 | #339 | Tragic 3.10 |
| Finns | 0.0 /100 | #340 | Tragic 3.09 |
| Poles | 0.0 /100 | #341 | Tragic 3.09 |
| Germans | 0.0 /100 | #342 | Tragic 3.09 |
| Norwegians | 0.0 /100 | #343 | Tragic 3.08 |
| French Canadians | 0.0 /100 | #344 | Tragic 3.07 |
| Slovenes | 0.0 /100 | #345 | Tragic 3.07 |
| Slovaks | 0.0 /100 | #346 | Tragic 3.06 |
| Carpatho Rusyns | 0.0 /100 | #347 | Tragic 3.06 |