Black/African American vs Immigrants from India Average Family Size
COMPARE
Black/African American
Immigrants from India
Average Family Size
Average Family Size Comparison
Blacks/African Americans
Immigrants from India
3.27
AVERAGE FAMILY SIZE
95.7/ 100
METRIC RATING
112th/ 347
METRIC RANK
3.21
AVERAGE FAMILY SIZE
18.5/ 100
METRIC RATING
202nd/ 347
METRIC RANK
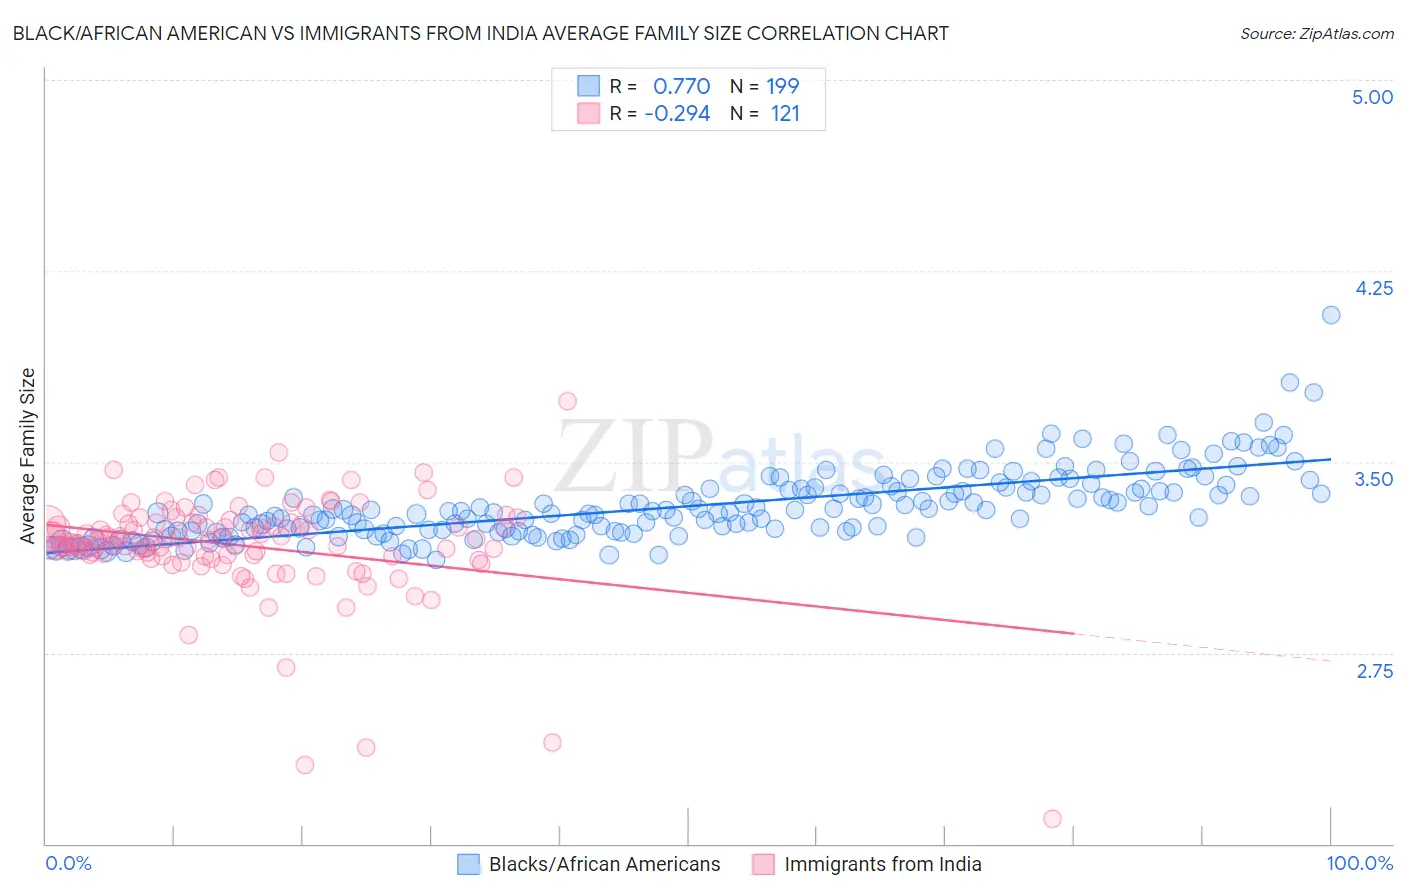
Black/African American vs Immigrants from India Average Family Size Correlation Chart
The statistical analysis conducted on geographies consisting of 565,344,221 people shows a strong positive correlation between the proportion of Blacks/African Americans and average family size in the United States with a correlation coefficient (R) of 0.770 and weighted average of 3.27. Similarly, the statistical analysis conducted on geographies consisting of 433,752,705 people shows a weak negative correlation between the proportion of Immigrants from India and average family size in the United States with a correlation coefficient (R) of -0.294 and weighted average of 3.21, a difference of 2.1%.
Average Family Size Correlation Summary
| Measurement | Black/African American | Immigrants from India |
| Minimum | 3.12 | 2.10 |
| Maximum | 4.08 | 3.74 |
| Range | 0.96 | 1.64 |
| Mean | 3.33 | 3.17 |
| Median | 3.30 | 3.19 |
| Interquartile 25% (IQ1) | 3.23 | 3.13 |
| Interquartile 75% (IQ3) | 3.39 | 3.26 |
| Interquartile Range (IQR) | 0.16 | 0.13 |
| Standard Deviation (Sample) | 0.14 | 0.21 |
| Standard Deviation (Population) | 0.14 | 0.21 |
Similar Demographics by Average Family Size
Demographics Similar to Blacks/African Americans by Average Family Size
In terms of average family size, the demographic groups most similar to Blacks/African Americans are Immigrants from Panama (3.27, a difference of 0.010%), Indonesian (3.28, a difference of 0.060%), South American (3.27, a difference of 0.060%), Immigrants from Liberia (3.27, a difference of 0.070%), and Immigrants from South America (3.27, a difference of 0.070%).
| Demographics | Rating | Rank | Average Family Size |
| Immigrants | Ghana | 98.1 /100 | #105 | Exceptional 3.29 |
| Paiute | 98.0 /100 | #106 | Exceptional 3.29 |
| Ghanaians | 98.0 /100 | #107 | Exceptional 3.29 |
| Asians | 97.0 /100 | #108 | Exceptional 3.28 |
| Puerto Ricans | 96.7 /100 | #109 | Exceptional 3.28 |
| Bahamians | 96.6 /100 | #110 | Exceptional 3.28 |
| Indonesians | 96.2 /100 | #111 | Exceptional 3.28 |
| Blacks/African Americans | 95.7 /100 | #112 | Exceptional 3.27 |
| Immigrants | Panama | 95.6 /100 | #113 | Exceptional 3.27 |
| South Americans | 95.1 /100 | #114 | Exceptional 3.27 |
| Immigrants | Liberia | 95.0 /100 | #115 | Exceptional 3.27 |
| Immigrants | South America | 95.0 /100 | #116 | Exceptional 3.27 |
| Kiowa | 94.8 /100 | #117 | Exceptional 3.27 |
| Immigrants | Asia | 94.0 /100 | #118 | Exceptional 3.27 |
| Immigrants | Indonesia | 93.7 /100 | #119 | Exceptional 3.27 |
Demographics Similar to Immigrants from India by Average Family Size
In terms of average family size, the demographic groups most similar to Immigrants from India are Immigrants from Morocco (3.21, a difference of 0.0%), Immigrants from Nepal (3.21, a difference of 0.010%), Immigrants from Kenya (3.21, a difference of 0.020%), Immigrants from Poland (3.20, a difference of 0.060%), and Hmong (3.21, a difference of 0.070%).
| Demographics | Rating | Rank | Average Family Size |
| Choctaw | 28.3 /100 | #195 | Fair 3.21 |
| Senegalese | 28.2 /100 | #196 | Fair 3.21 |
| Kenyans | 28.0 /100 | #197 | Fair 3.21 |
| Immigrants | Azores | 21.7 /100 | #198 | Fair 3.21 |
| Hmong | 20.7 /100 | #199 | Fair 3.21 |
| Immigrants | Kenya | 19.2 /100 | #200 | Poor 3.21 |
| Immigrants | Morocco | 18.5 /100 | #201 | Poor 3.21 |
| Immigrants | India | 18.5 /100 | #202 | Poor 3.21 |
| Immigrants | Nepal | 18.1 /100 | #203 | Poor 3.21 |
| Immigrants | Poland | 16.6 /100 | #204 | Poor 3.20 |
| Paraguayans | 16.3 /100 | #205 | Poor 3.20 |
| Immigrants | Cabo Verde | 16.0 /100 | #206 | Poor 3.20 |
| Filipinos | 13.6 /100 | #207 | Poor 3.20 |
| Chippewa | 13.3 /100 | #208 | Poor 3.20 |
| Sudanese | 13.3 /100 | #209 | Poor 3.20 |