Black/African American vs Immigrants from Cameroon Average Family Size
COMPARE
Black/African American
Immigrants from Cameroon
Average Family Size
Average Family Size Comparison
Blacks/African Americans
Immigrants from Cameroon
3.27
AVERAGE FAMILY SIZE
95.7/ 100
METRIC RATING
112th/ 347
METRIC RANK
3.30
AVERAGE FAMILY SIZE
99.2/ 100
METRIC RATING
92nd/ 347
METRIC RANK
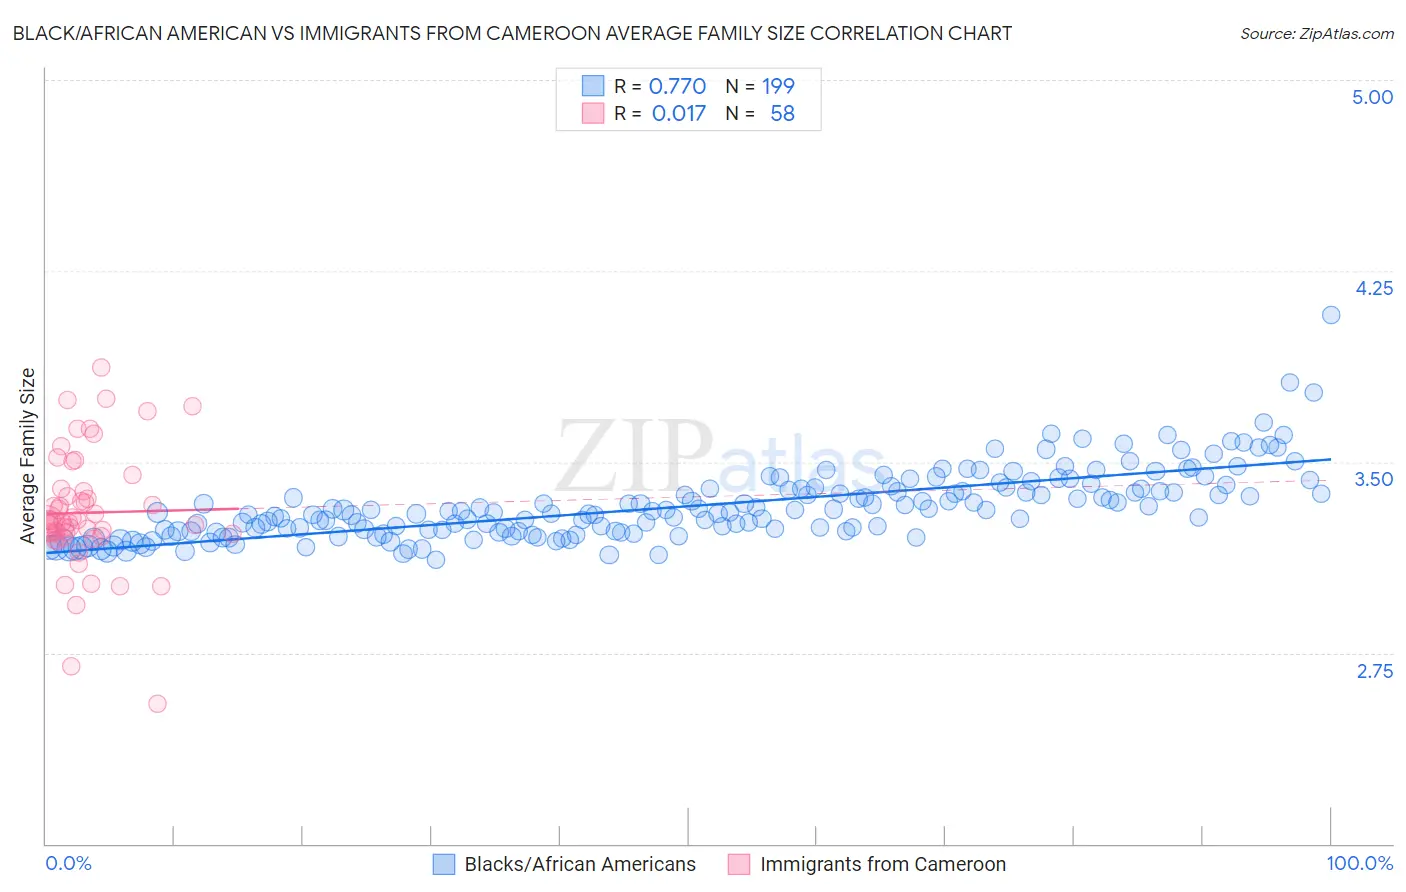
Black/African American vs Immigrants from Cameroon Average Family Size Correlation Chart
The statistical analysis conducted on geographies consisting of 565,344,221 people shows a strong positive correlation between the proportion of Blacks/African Americans and average family size in the United States with a correlation coefficient (R) of 0.770 and weighted average of 3.27. Similarly, the statistical analysis conducted on geographies consisting of 130,723,940 people shows no correlation between the proportion of Immigrants from Cameroon and average family size in the United States with a correlation coefficient (R) of 0.017 and weighted average of 3.30, a difference of 0.78%.
Average Family Size Correlation Summary
| Measurement | Black/African American | Immigrants from Cameroon |
| Minimum | 3.12 | 2.55 |
| Maximum | 4.08 | 3.87 |
| Range | 0.96 | 1.32 |
| Mean | 3.33 | 3.30 |
| Median | 3.30 | 3.26 |
| Interquartile 25% (IQ1) | 3.23 | 3.22 |
| Interquartile 75% (IQ3) | 3.39 | 3.38 |
| Interquartile Range (IQR) | 0.16 | 0.17 |
| Standard Deviation (Sample) | 0.14 | 0.24 |
| Standard Deviation (Population) | 0.14 | 0.23 |
Demographics Similar to Blacks/African Americans and Immigrants from Cameroon by Average Family Size
In terms of average family size, the demographic groups most similar to Blacks/African Americans are Indonesian (3.28, a difference of 0.060%), Bahamian (3.28, a difference of 0.11%), Puerto Rican (3.28, a difference of 0.13%), Asian (3.28, a difference of 0.17%), and Ghanaian (3.29, a difference of 0.35%). Similarly, the demographic groups most similar to Immigrants from Cameroon are Peruvian (3.30, a difference of 0.010%), Sierra Leonean (3.30, a difference of 0.11%), Immigrants from Lebanon (3.30, a difference of 0.12%), U.S. Virgin Islander (3.29, a difference of 0.20%), and Immigrants from Oceania (3.29, a difference of 0.24%).
| Demographics | Rating | Rank | Average Family Size |
| Immigrants | Cameroon | 99.2 /100 | #92 | Exceptional 3.30 |
| Peruvians | 99.2 /100 | #93 | Exceptional 3.30 |
| Sierra Leoneans | 99.0 /100 | #94 | Exceptional 3.30 |
| Immigrants | Lebanon | 99.0 /100 | #95 | Exceptional 3.30 |
| U.S. Virgin Islanders | 98.8 /100 | #96 | Exceptional 3.29 |
| Immigrants | Oceania | 98.7 /100 | #97 | Exceptional 3.29 |
| Barbadians | 98.6 /100 | #98 | Exceptional 3.29 |
| Nigerians | 98.6 /100 | #99 | Exceptional 3.29 |
| Guamanians/Chamorros | 98.6 /100 | #100 | Exceptional 3.29 |
| Immigrants | Burma/Myanmar | 98.6 /100 | #101 | Exceptional 3.29 |
| West Indians | 98.5 /100 | #102 | Exceptional 3.29 |
| Immigrants | Western Africa | 98.4 /100 | #103 | Exceptional 3.29 |
| Bolivians | 98.3 /100 | #104 | Exceptional 3.29 |
| Immigrants | Ghana | 98.1 /100 | #105 | Exceptional 3.29 |
| Paiute | 98.0 /100 | #106 | Exceptional 3.29 |
| Ghanaians | 98.0 /100 | #107 | Exceptional 3.29 |
| Asians | 97.0 /100 | #108 | Exceptional 3.28 |
| Puerto Ricans | 96.7 /100 | #109 | Exceptional 3.28 |
| Bahamians | 96.6 /100 | #110 | Exceptional 3.28 |
| Indonesians | 96.2 /100 | #111 | Exceptional 3.28 |
| Blacks/African Americans | 95.7 /100 | #112 | Exceptional 3.27 |