Chinese vs Creek Family Households with Children

COMPARE

Chinese
Race
Ancestry
AfghanAfricanAlaska NativeAlaskan AthabascanAlbanianAleutAlsatianAmericanApacheArabArapahoArgentineanArmenianAssyrian/Chaldean/SyriacAustralianAustrianBahamianBangladeshiBarbadianBasqueBelgianBelizeanBermudanBhutaneseBlackfeetBolivianBrazilianBritishBritish West IndianBulgarianBurmeseCajunCambodianCanadianCape VerdeanCarpatho RusynCelticCentral AmericanCentral American IndianCherokeeCheyenneChickasawChileanChineseChippewaChoctawColombianColvilleComancheCosta RicanCreeCroatianCrowCubanCypriotCzechCzechoslovakianDanishDelawareDominicanDutchDutch West IndianEastern EuropeanEcuadorianEgyptianEnglishEstonianEthiopianEuropeanFijianFilipinoFinnishFrenchFrench American IndianFrench CanadianGermanGerman RussianGhanaianGreekGuamanian/ChamorroGuatemalanGuyaneseHaitianHmongHonduranHopiHoumaHungarianIcelanderIndian (Asian)IndonesianInupiatIranianIraqiIrishIroquoisIsraeliItalianJamaicanJapaneseJordanianKenyanKiowaKoreanLaotianLatvianLebaneseLiberianLithuanianLumbeeLuxembourgerMacedonianMalaysianMalteseMarshalleseMenomineeMexicanMexican American IndianMongolianMoroccanNative HawaiianNavajoNepaleseNew ZealanderNicaraguanNigerianNorthern EuropeanNorwegianOkinawanOsageOttawaPaiutePakistaniPalestinianPanamanianParaguayanPennsylvania GermanPeruvianPimaPolishPortuguesePotawatomiPuebloPuerto RicanPuget Sound SalishRomanianRussianSalvadoranSamoanScandinavianScotch-IrishScottishSeminoleSenegaleseSerbianShoshoneSierra LeoneanSiouxSlavicSlovakSloveneSomaliSouth AfricanSouth AmericanSouth American IndianSoviet UnionSpaniardSpanishSpanish AmericanSpanish American IndianSri LankanSubsaharan AfricanSudaneseSwedishSwissSyrianTaiwaneseThaiTlingit-HaidaTohono O'OdhamTonganTrinidadian and TobagonianTsimshianTurkishU.S. Virgin IslanderUgandanUkrainianUruguayanUteVenezuelanVietnameseWelshWest IndianYakamaYaquiYugoslavianYumanYup'ikZimbabwean
Immigration
NonimmigrantsImmigrantsAfghanistanAfricaAlbaniaArgentinaArmeniaAsiaAustraliaAustriaBahamasBangladeshBarbadosBelarusBelgiumBelizeBoliviaBosnia and HerzegovinaBrazilBulgariaBurma/MyanmarCabo VerdeCambodiaCameroonCanadaCaribbeanCentral AmericaChileChinaColombiaCongoCosta RicaCroatiaCubaCzechoslovakiaDenmarkDominicaDominican RepublicEastern AfricaEastern AsiaEastern EuropeEcuadorEgyptEl SalvadorEnglandEritreaEthiopiaEuropeFijiFranceGermanyGhanaGreeceGrenadaGuatemalaGuyanaHaitiHondurasHong KongHungaryIndiaIndonesiaIranIraqIrelandIsraelItalyJamaicaJapanJordanKazakhstanKenyaKoreaKuwaitLaosLatin AmericaLatviaLebanonLiberiaLithuaniaMalaysiaMexicoMicronesiaMiddle AfricaMoldovaMoroccoNepalNetherlandsNicaraguaNigeriaNorth AmericaNorth MacedoniaNorthern AfricaNorthern EuropeNorwayOceaniaPakistanPanamaPeruPhilippinesPolandPortugalRomaniaRussiaSaudi ArabiaScotlandSenegalSerbiaSierra LeoneSingaporeSomaliaSouth AfricaSouth AmericaSouth Central AsiaSouth Eastern AsiaSouthern EuropeSpainSri LankaSt. Vincent and the GrenadinesSudanSwedenSwitzerlandSyriaTaiwanThailandTrinidad and TobagoTurkeyUgandaUkraineUruguayUzbekistanVenezuelaVietnamWest IndiesWestern AfricaWestern AsiaWestern EuropeYemenZaireZimbabweAzores
Creek
Race
Ancestry
AfghanAfricanAlaska NativeAlaskan AthabascanAlbanianAleutAlsatianAmericanApacheArabArapahoArgentineanArmenianAssyrian/Chaldean/SyriacAustralianAustrianBahamianBangladeshiBarbadianBasqueBelgianBelizeanBermudanBhutaneseBlackfeetBolivianBrazilianBritishBritish West IndianBulgarianBurmeseCajunCambodianCanadianCape VerdeanCarpatho RusynCelticCentral AmericanCentral American IndianCherokeeCheyenneChickasawChileanChippewaChoctawColombianColvilleComancheCosta RicanCreeCreekCroatianCrowCubanCypriotCzechCzechoslovakianDanishDelawareDominicanDutchDutch West IndianEastern EuropeanEcuadorianEgyptianEnglishEstonianEthiopianEuropeanFijianFilipinoFinnishFrenchFrench American IndianFrench CanadianGermanGerman RussianGhanaianGreekGuamanian/ChamorroGuatemalanGuyaneseHaitianHmongHonduranHopiHoumaHungarianIcelanderIndian (Asian)IndonesianInupiatIranianIraqiIrishIroquoisIsraeliItalianJamaicanJapaneseJordanianKenyanKiowaKoreanLaotianLatvianLebaneseLiberianLithuanianLumbeeLuxembourgerMacedonianMalaysianMalteseMarshalleseMenomineeMexicanMexican American IndianMongolianMoroccanNative HawaiianNavajoNepaleseNew ZealanderNicaraguanNigerianNorthern EuropeanNorwegianOkinawanOsageOttawaPaiutePakistaniPalestinianPanamanianParaguayanPennsylvania GermanPeruvianPimaPolishPortuguesePotawatomiPuebloPuerto RicanPuget Sound SalishRomanianRussianSalvadoranSamoanScandinavianScotch-IrishScottishSeminoleSenegaleseSerbianShoshoneSierra LeoneanSiouxSlavicSlovakSloveneSomaliSouth AfricanSouth AmericanSouth American IndianSoviet UnionSpaniardSpanishSpanish AmericanSpanish American IndianSri LankanSubsaharan AfricanSudaneseSwedishSwissSyrianTaiwaneseThaiTlingit-HaidaTohono O'OdhamTonganTrinidadian and TobagonianTsimshianTurkishU.S. Virgin IslanderUgandanUkrainianUruguayanUteVenezuelanVietnameseWelshWest IndianYakamaYaquiYugoslavianYumanYup'ikZimbabwean
Immigration
NonimmigrantsImmigrantsAfghanistanAfricaAlbaniaArgentinaArmeniaAsiaAustraliaAustriaBahamasBangladeshBarbadosBelarusBelgiumBelizeBoliviaBosnia and HerzegovinaBrazilBulgariaBurma/MyanmarCabo VerdeCambodiaCameroonCanadaCaribbeanCentral AmericaChileChinaColombiaCongoCosta RicaCroatiaCubaCzechoslovakiaDenmarkDominicaDominican RepublicEastern AfricaEastern AsiaEastern EuropeEcuadorEgyptEl SalvadorEnglandEritreaEthiopiaEuropeFijiFranceGermanyGhanaGreeceGrenadaGuatemalaGuyanaHaitiHondurasHong KongHungaryIndiaIndonesiaIranIraqIrelandIsraelItalyJamaicaJapanJordanKazakhstanKenyaKoreaKuwaitLaosLatin AmericaLatviaLebanonLiberiaLithuaniaMalaysiaMexicoMicronesiaMiddle AfricaMoldovaMoroccoNepalNetherlandsNicaraguaNigeriaNorth AmericaNorth MacedoniaNorthern AfricaNorthern EuropeNorwayOceaniaPakistanPanamaPeruPhilippinesPolandPortugalRomaniaRussiaSaudi ArabiaScotlandSenegalSerbiaSierra LeoneSingaporeSomaliaSouth AfricaSouth AmericaSouth Central AsiaSouth Eastern AsiaSouthern EuropeSpainSri LankaSt. Vincent and the GrenadinesSudanSwedenSwitzerlandSyriaTaiwanThailandTrinidad and TobagoTurkeyUgandaUkraineUruguayUzbekistanVenezuelaVietnamWest IndiesWestern AfricaWestern AsiaWestern EuropeYemenZaireZimbabweAzores
Family Households with Children
Income
Poverty
Unemployment
Labor Participation
Family Structure
Vehicle Availability
Education Level
Disability

Family Households with Children Comparison

Chinese

Creek

Tragic
Fair
26.0%
FAMILY HOUSEHOLDS WITH CHILDREN
0.0/ 100
METRIC RATING
324th/ 347
METRIC RANK
27.4%
FAMILY HOUSEHOLDS WITH CHILDREN
39.8/ 100
METRIC RATING
187th/ 347
METRIC RANK

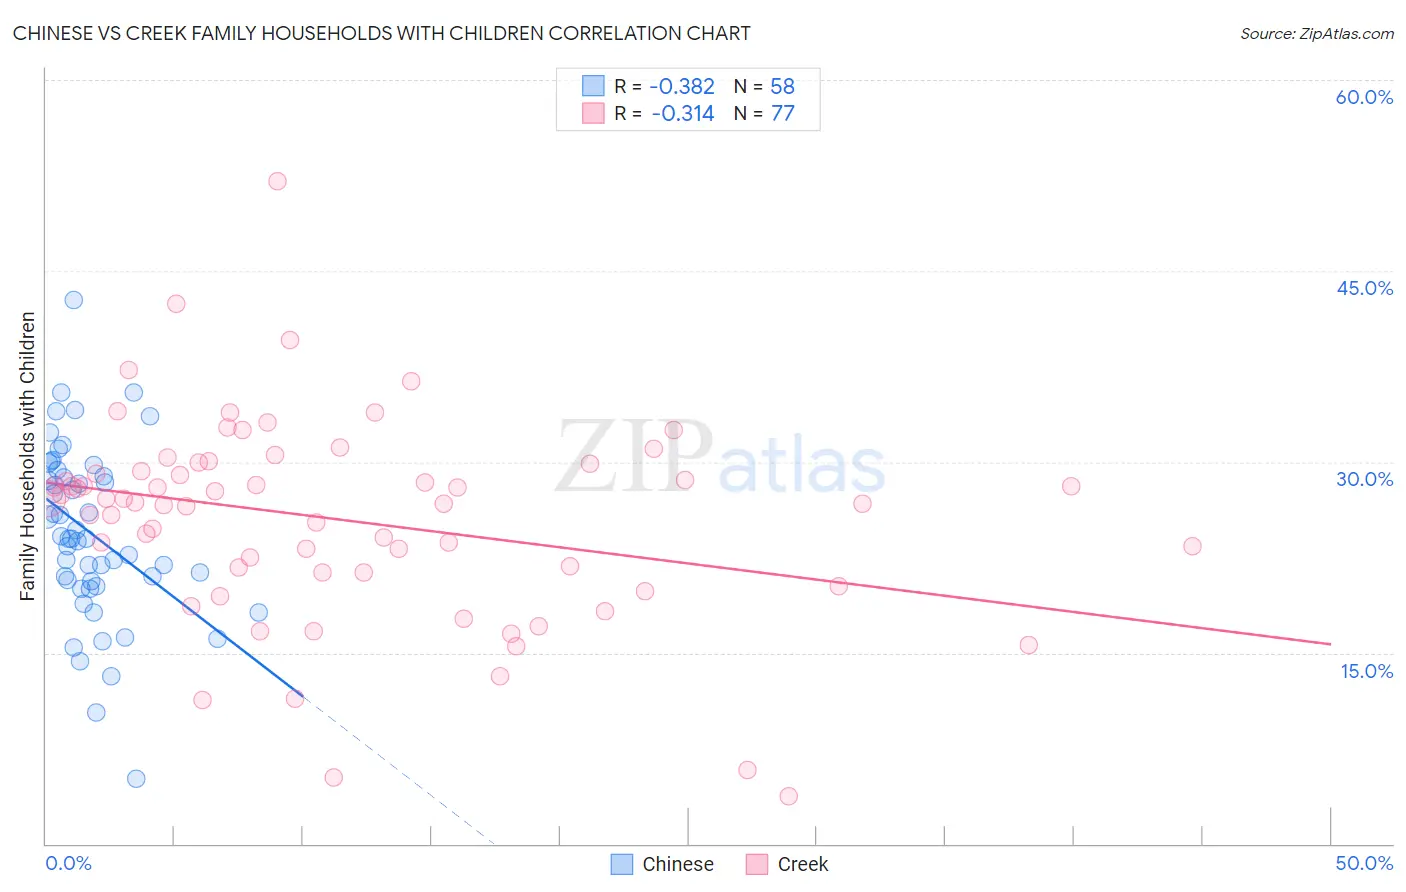
Chinese vs Creek Family Households with Children Correlation Chart

The statistical analysis conducted on geographies consisting of 64,800,060 people shows a mild negative correlation between the proportion of Chinese and percentage of family households with children in the United States with a correlation coefficient (R) of -0.382 and weighted average of 26.0%. Similarly, the statistical analysis conducted on geographies consisting of 178,422,790 people shows a mild negative correlation between the proportion of Creek and percentage of family households with children in the United States with a correlation coefficient (R) of -0.314 and weighted average of 27.4%, a difference of 5.3%.
Chinese vs Creek Family Households with Children

Family Households with Children Correlation Summary

MeasurementChineseCreek
Minimum5.1%3.8%
Maximum42.8%52.1%
Range37.7%48.3%
Mean24.4%25.4%
Median24.0%26.8%
Interquartile 25% (IQ1)20.6%21.3%
Interquartile 75% (IQ3)28.8%29.6%
Interquartile Range (IQR)8.2%8.2%
Standard Deviation (Sample)6.8%8.0%
Standard Deviation (Population)6.7%7.9%

Similar Demographics by Family Households with Children

Demographics Similar to Chinese by Family Households with Children

In terms of family households with children, the demographic groups most similar to Chinese are Immigrants from Australia (26.0%, a difference of 0.030%), Barbadian (26.0%, a difference of 0.060%), Immigrants from Greece (26.0%, a difference of 0.070%), British West Indian (26.0%, a difference of 0.080%), and Immigrants from Ireland (26.0%, a difference of 0.080%).
DemographicsRating | RankFamily Households with Children
Ottawa
0.0
/100
|
#317
Tragic
26.1%
Iroquois
0.0
/100
|
#318
Tragic
26.1%
Immigrants | France
0.0
/100
|
#319
Tragic
26.0%
Tlingit-Haida
0.0
/100
|
#320
Tragic
26.0%
British West Indians
0.0
/100
|
#321
Tragic
26.0%
Immigrants | Greece
0.0
/100
|
#322
Tragic
26.0%
Immigrants | Australia
0.0
/100
|
#323
Tragic
26.0%
Chinese
0.0
/100
|
#324
Tragic
26.0%
Barbadians
0.0
/100
|
#325
Tragic
26.0%
Immigrants | Ireland
0.0
/100
|
#326
Tragic
26.0%
Immigrants | Barbados
0.0
/100
|
#327
Tragic
26.0%
Immigrants | Albania
0.0
/100
|
#328
Tragic
25.9%
Cypriots
0.0
/100
|
#329
Tragic
25.9%
Immigrants | Latvia
0.0
/100
|
#330
Tragic
25.9%
Slovenes
0.0
/100
|
#331
Tragic
25.8%

Demographics Similar to Creek by Family Households with Children

In terms of family households with children, the demographic groups most similar to Creek are Immigrants from Brazil (27.4%, a difference of 0.020%), Dutch (27.4%, a difference of 0.020%), Immigrants from Israel (27.4%, a difference of 0.040%), Delaware (27.4%, a difference of 0.050%), and Immigrants from Uruguay (27.4%, a difference of 0.050%).
DemographicsRating | RankFamily Households with Children
Immigrants | Turkey
46.9
/100
|
#180
Average
27.4%
Aleuts
46.7
/100
|
#181
Average
27.4%
Puget Sound Salish
46.2
/100
|
#182
Average
27.4%
South Africans
44.9
/100
|
#183
Average
27.4%
Native Hawaiians
44.6
/100
|
#184
Average
27.4%
Delaware
42.0
/100
|
#185
Average
27.4%
Immigrants | Brazil
40.6
/100
|
#186
Average
27.4%
Creek
39.8
/100
|
#187
Fair
27.4%
Dutch
38.8
/100
|
#188
Fair
27.4%
Immigrants | Israel
37.9
/100
|
#189
Fair
27.4%
Immigrants | Uruguay
37.7
/100
|
#190
Fair
27.4%
Sudanese
37.6
/100
|
#191
Fair
27.4%
Pennsylvania Germans
37.5
/100
|
#192
Fair
27.4%
Swedes
36.9
/100
|
#193
Fair
27.4%
Immigrants | Iran
36.1
/100
|
#194
Fair
27.4%