Northern European vs Creek Family Households with Children
COMPARE
Northern European
Creek
Family Households with Children
Family Households with Children Comparison
Northern Europeans
Creek
27.2%
FAMILY HOUSEHOLDS WITH CHILDREN
12.8/ 100
METRIC RATING
215th/ 347
METRIC RANK
27.4%
FAMILY HOUSEHOLDS WITH CHILDREN
39.8/ 100
METRIC RATING
187th/ 347
METRIC RANK
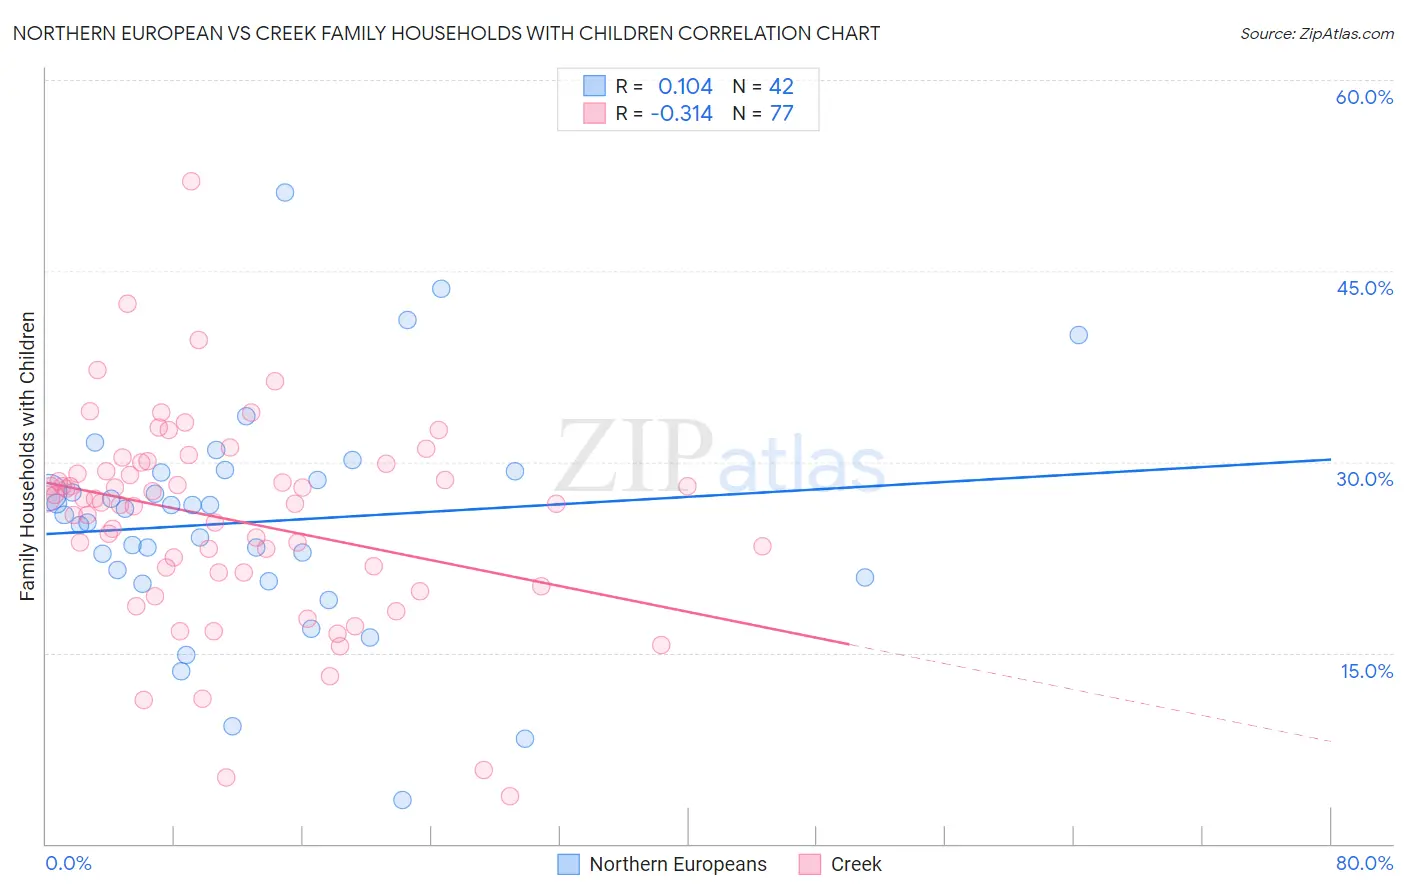
Northern European vs Creek Family Households with Children Correlation Chart
The statistical analysis conducted on geographies consisting of 405,770,023 people shows a poor positive correlation between the proportion of Northern Europeans and percentage of family households with children in the United States with a correlation coefficient (R) of 0.104 and weighted average of 27.2%. Similarly, the statistical analysis conducted on geographies consisting of 178,422,790 people shows a mild negative correlation between the proportion of Creek and percentage of family households with children in the United States with a correlation coefficient (R) of -0.314 and weighted average of 27.4%, a difference of 0.84%.
Family Households with Children Correlation Summary
| Measurement | Northern European | Creek |
| Minimum | 3.5% | 3.8% |
| Maximum | 51.2% | 52.1% |
| Range | 47.7% | 48.3% |
| Mean | 25.3% | 25.4% |
| Median | 26.1% | 26.8% |
| Interquartile 25% (IQ1) | 20.9% | 21.3% |
| Interquartile 75% (IQ3) | 29.2% | 29.6% |
| Interquartile Range (IQR) | 8.3% | 8.2% |
| Standard Deviation (Sample) | 9.0% | 8.0% |
| Standard Deviation (Population) | 8.8% | 7.9% |
Similar Demographics by Family Households with Children
Demographics Similar to Northern Europeans by Family Households with Children
In terms of family households with children, the demographic groups most similar to Northern Europeans are African (27.2%, a difference of 0.010%), Cuban (27.1%, a difference of 0.030%), U.S. Virgin Islander (27.1%, a difference of 0.030%), Okinawan (27.2%, a difference of 0.040%), and Immigrants from Dominica (27.2%, a difference of 0.050%).
| Demographics | Rating | Rank | Family Households with Children |
| Immigrants | Poland | 16.4 /100 | #208 | Poor 27.2% |
| Dutch West Indians | 15.8 /100 | #209 | Poor 27.2% |
| Immigrants | Ukraine | 14.4 /100 | #210 | Poor 27.2% |
| Welsh | 14.2 /100 | #211 | Poor 27.2% |
| Immigrants | Dominica | 13.9 /100 | #212 | Poor 27.2% |
| Okinawans | 13.7 /100 | #213 | Poor 27.2% |
| Africans | 13.0 /100 | #214 | Poor 27.2% |
| Northern Europeans | 12.8 /100 | #215 | Poor 27.2% |
| Cubans | 12.2 /100 | #216 | Poor 27.1% |
| U.S. Virgin Islanders | 12.1 /100 | #217 | Poor 27.1% |
| Greeks | 11.4 /100 | #218 | Poor 27.1% |
| Immigrants | Japan | 10.7 /100 | #219 | Poor 27.1% |
| Austrians | 9.9 /100 | #220 | Tragic 27.1% |
| New Zealanders | 9.6 /100 | #221 | Tragic 27.1% |
| Paraguayans | 9.4 /100 | #222 | Tragic 27.1% |
Demographics Similar to Creek by Family Households with Children
In terms of family households with children, the demographic groups most similar to Creek are Immigrants from Brazil (27.4%, a difference of 0.020%), Dutch (27.4%, a difference of 0.020%), Immigrants from Israel (27.4%, a difference of 0.040%), Delaware (27.4%, a difference of 0.050%), and Immigrants from Uruguay (27.4%, a difference of 0.050%).
| Demographics | Rating | Rank | Family Households with Children |
| Immigrants | Turkey | 46.9 /100 | #180 | Average 27.4% |
| Aleuts | 46.7 /100 | #181 | Average 27.4% |
| Puget Sound Salish | 46.2 /100 | #182 | Average 27.4% |
| South Africans | 44.9 /100 | #183 | Average 27.4% |
| Native Hawaiians | 44.6 /100 | #184 | Average 27.4% |
| Delaware | 42.0 /100 | #185 | Average 27.4% |
| Immigrants | Brazil | 40.6 /100 | #186 | Average 27.4% |
| Creek | 39.8 /100 | #187 | Fair 27.4% |
| Dutch | 38.8 /100 | #188 | Fair 27.4% |
| Immigrants | Israel | 37.9 /100 | #189 | Fair 27.4% |
| Immigrants | Uruguay | 37.7 /100 | #190 | Fair 27.4% |
| Sudanese | 37.6 /100 | #191 | Fair 27.4% |
| Pennsylvania Germans | 37.5 /100 | #192 | Fair 27.4% |
| Swedes | 36.9 /100 | #193 | Fair 27.4% |
| Immigrants | Iran | 36.1 /100 | #194 | Fair 27.4% |