Blackfeet vs Immigrants from Congo Single Father Households
COMPARE
Blackfeet
Immigrants from Congo
Single Father Households
Single Father Households Comparison
Blackfeet
Immigrants from Congo
2.7%
SINGLE FATHER HOUSEHOLDS
0.0/ 100
METRIC RATING
291st/ 347
METRIC RANK
2.5%
SINGLE FATHER HOUSEHOLDS
1.2/ 100
METRIC RATING
257th/ 347
METRIC RANK
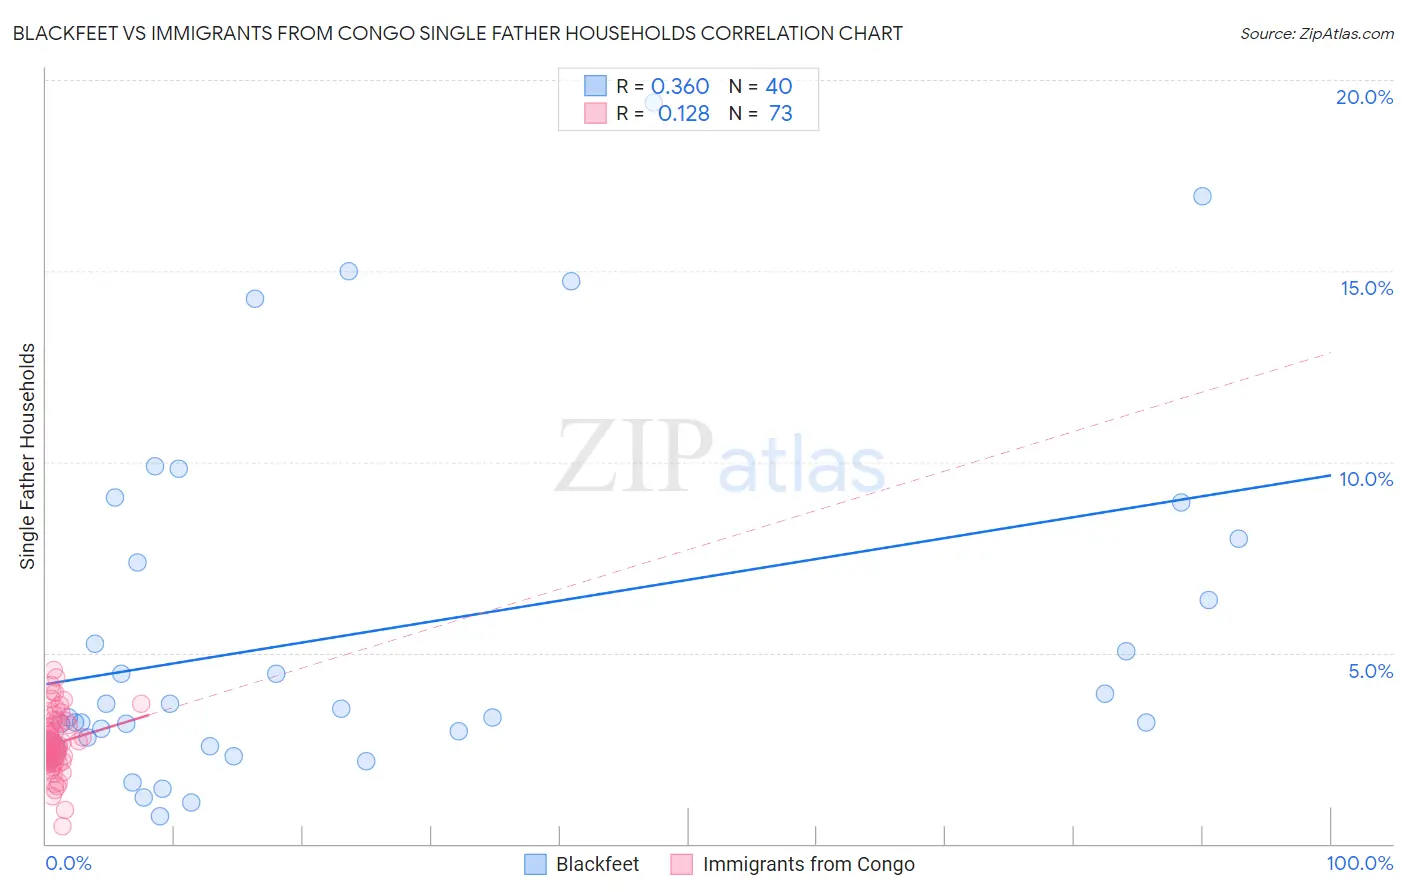
Blackfeet vs Immigrants from Congo Single Father Households Correlation Chart
The statistical analysis conducted on geographies consisting of 307,723,942 people shows a mild positive correlation between the proportion of Blackfeet and percentage of single father households in the United States with a correlation coefficient (R) of 0.360 and weighted average of 2.7%. Similarly, the statistical analysis conducted on geographies consisting of 91,926,363 people shows a poor positive correlation between the proportion of Immigrants from Congo and percentage of single father households in the United States with a correlation coefficient (R) of 0.128 and weighted average of 2.5%, a difference of 6.9%.
Single Father Households Correlation Summary
| Measurement | Blackfeet | Immigrants from Congo |
| Minimum | 0.71% | 0.46% |
| Maximum | 19.4% | 4.5% |
| Range | 18.7% | 4.1% |
| Mean | 5.6% | 2.6% |
| Median | 3.4% | 2.5% |
| Interquartile 25% (IQ1) | 2.7% | 2.2% |
| Interquartile 75% (IQ3) | 7.7% | 3.1% |
| Interquartile Range (IQR) | 5.0% | 0.93% |
| Standard Deviation (Sample) | 4.7% | 0.77% |
| Standard Deviation (Population) | 4.6% | 0.76% |
Similar Demographics by Single Father Households
Demographics Similar to Blackfeet by Single Father Households
In terms of single father households, the demographic groups most similar to Blackfeet are Choctaw (2.7%, a difference of 0.46%), Puget Sound Salish (2.7%, a difference of 0.56%), Immigrants from Fiji (2.7%, a difference of 0.62%), Tlingit-Haida (2.7%, a difference of 1.0%), and Malaysian (2.7%, a difference of 1.1%).
| Demographics | Rating | Rank | Single Father Households |
| Hawaiians | 0.1 /100 | #284 | Tragic 2.7% |
| Ottawa | 0.1 /100 | #285 | Tragic 2.7% |
| Immigrants | Cuba | 0.1 /100 | #286 | Tragic 2.7% |
| Central American Indians | 0.0 /100 | #287 | Tragic 2.7% |
| Immigrants | Cambodia | 0.0 /100 | #288 | Tragic 2.7% |
| Tlingit-Haida | 0.0 /100 | #289 | Tragic 2.7% |
| Puget Sound Salish | 0.0 /100 | #290 | Tragic 2.7% |
| Blackfeet | 0.0 /100 | #291 | Tragic 2.7% |
| Choctaw | 0.0 /100 | #292 | Tragic 2.7% |
| Immigrants | Fiji | 0.0 /100 | #293 | Tragic 2.7% |
| Malaysians | 0.0 /100 | #294 | Tragic 2.7% |
| Chickasaw | 0.0 /100 | #295 | Tragic 2.8% |
| Japanese | 0.0 /100 | #296 | Tragic 2.8% |
| Hondurans | 0.0 /100 | #297 | Tragic 2.8% |
| Cree | 0.0 /100 | #298 | Tragic 2.8% |
Demographics Similar to Immigrants from Congo by Single Father Households
In terms of single father households, the demographic groups most similar to Immigrants from Congo are Spanish (2.5%, a difference of 0.090%), Comanche (2.5%, a difference of 0.24%), Potawatomi (2.5%, a difference of 0.29%), Immigrants from Caribbean (2.5%, a difference of 0.33%), and Tongan (2.5%, a difference of 0.34%).
| Demographics | Rating | Rank | Single Father Households |
| Somalis | 2.1 /100 | #250 | Tragic 2.5% |
| Liberians | 2.0 /100 | #251 | Tragic 2.5% |
| Immigrants | Eritrea | 2.0 /100 | #252 | Tragic 2.5% |
| Immigrants | Somalia | 1.9 /100 | #253 | Tragic 2.5% |
| Immigrants | Thailand | 1.8 /100 | #254 | Tragic 2.5% |
| Tongans | 1.5 /100 | #255 | Tragic 2.5% |
| Potawatomi | 1.4 /100 | #256 | Tragic 2.5% |
| Immigrants | Congo | 1.2 /100 | #257 | Tragic 2.5% |
| Spanish | 1.1 /100 | #258 | Tragic 2.5% |
| Comanche | 1.0 /100 | #259 | Tragic 2.5% |
| Immigrants | Caribbean | 1.0 /100 | #260 | Tragic 2.5% |
| Immigrants | Belize | 0.9 /100 | #261 | Tragic 2.5% |
| Immigrants | Liberia | 0.8 /100 | #262 | Tragic 2.5% |
| Dominicans | 0.8 /100 | #263 | Tragic 2.5% |
| Indonesians | 0.5 /100 | #264 | Tragic 2.6% |