Blackfeet vs African Single Father Households
COMPARE
Blackfeet
African
Single Father Households
Single Father Households Comparison
Blackfeet
Africans
2.7%
SINGLE FATHER HOUSEHOLDS
0.0/ 100
METRIC RATING
291st/ 347
METRIC RANK
2.5%
SINGLE FATHER HOUSEHOLDS
6.3/ 100
METRIC RATING
234th/ 347
METRIC RANK
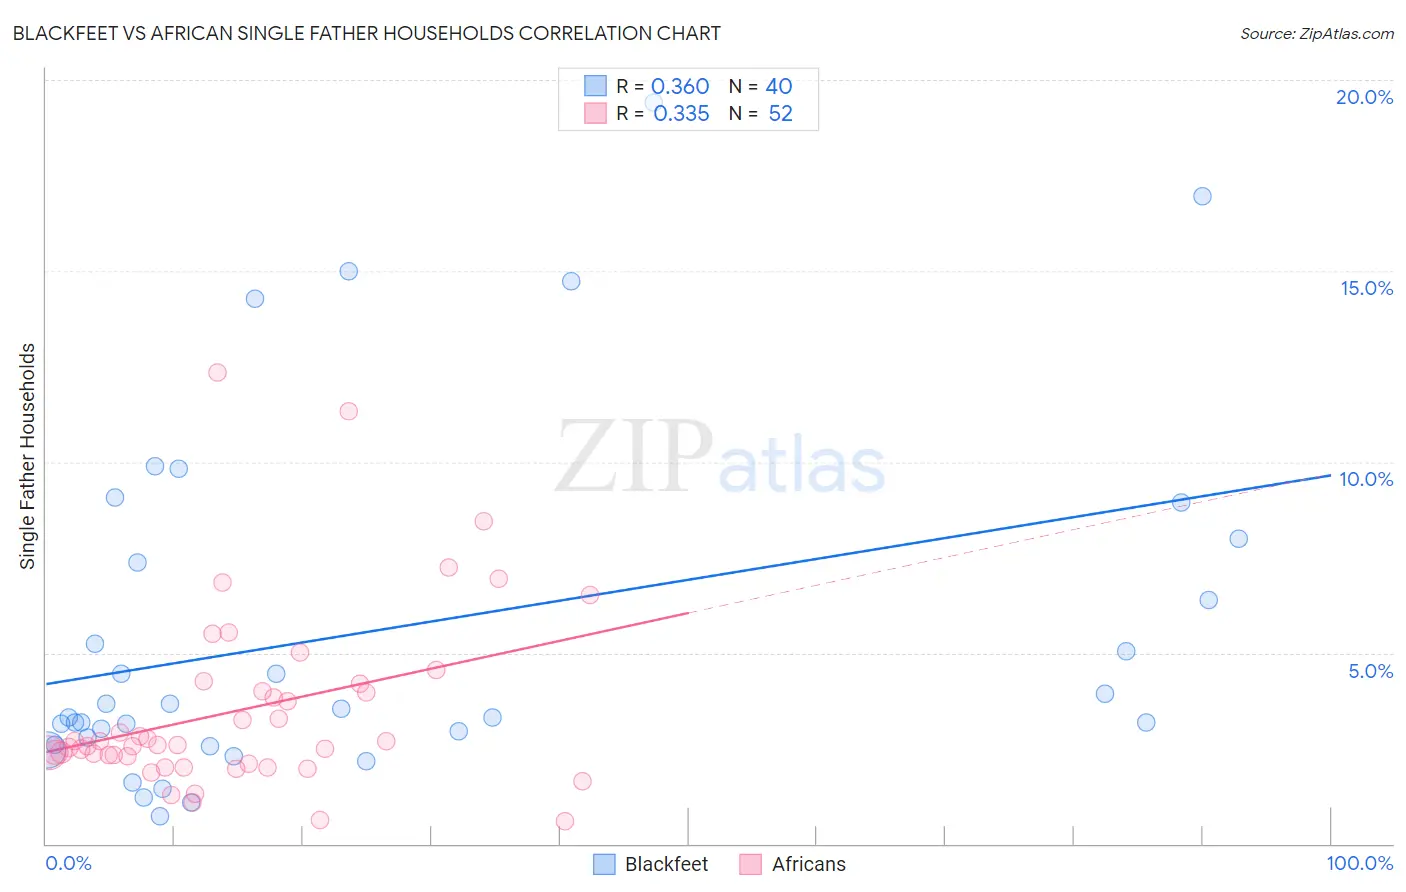
Blackfeet vs African Single Father Households Correlation Chart
The statistical analysis conducted on geographies consisting of 307,723,942 people shows a mild positive correlation between the proportion of Blackfeet and percentage of single father households in the United States with a correlation coefficient (R) of 0.360 and weighted average of 2.7%. Similarly, the statistical analysis conducted on geographies consisting of 464,994,675 people shows a mild positive correlation between the proportion of Africans and percentage of single father households in the United States with a correlation coefficient (R) of 0.335 and weighted average of 2.5%, a difference of 10.1%.
Single Father Households Correlation Summary
| Measurement | Blackfeet | African |
| Minimum | 0.71% | 0.60% |
| Maximum | 19.4% | 12.3% |
| Range | 18.7% | 11.7% |
| Mean | 5.6% | 3.5% |
| Median | 3.4% | 2.6% |
| Interquartile 25% (IQ1) | 2.7% | 2.2% |
| Interquartile 75% (IQ3) | 7.7% | 4.1% |
| Interquartile Range (IQR) | 5.0% | 1.9% |
| Standard Deviation (Sample) | 4.7% | 2.4% |
| Standard Deviation (Population) | 4.6% | 2.4% |
Similar Demographics by Single Father Households
Demographics Similar to Blackfeet by Single Father Households
In terms of single father households, the demographic groups most similar to Blackfeet are Choctaw (2.7%, a difference of 0.46%), Puget Sound Salish (2.7%, a difference of 0.56%), Immigrants from Fiji (2.7%, a difference of 0.62%), Tlingit-Haida (2.7%, a difference of 1.0%), and Malaysian (2.7%, a difference of 1.1%).
| Demographics | Rating | Rank | Single Father Households |
| Hawaiians | 0.1 /100 | #284 | Tragic 2.7% |
| Ottawa | 0.1 /100 | #285 | Tragic 2.7% |
| Immigrants | Cuba | 0.1 /100 | #286 | Tragic 2.7% |
| Central American Indians | 0.0 /100 | #287 | Tragic 2.7% |
| Immigrants | Cambodia | 0.0 /100 | #288 | Tragic 2.7% |
| Tlingit-Haida | 0.0 /100 | #289 | Tragic 2.7% |
| Puget Sound Salish | 0.0 /100 | #290 | Tragic 2.7% |
| Blackfeet | 0.0 /100 | #291 | Tragic 2.7% |
| Choctaw | 0.0 /100 | #292 | Tragic 2.7% |
| Immigrants | Fiji | 0.0 /100 | #293 | Tragic 2.7% |
| Malaysians | 0.0 /100 | #294 | Tragic 2.7% |
| Chickasaw | 0.0 /100 | #295 | Tragic 2.8% |
| Japanese | 0.0 /100 | #296 | Tragic 2.8% |
| Hondurans | 0.0 /100 | #297 | Tragic 2.8% |
| Cree | 0.0 /100 | #298 | Tragic 2.8% |
Demographics Similar to Africans by Single Father Households
In terms of single father households, the demographic groups most similar to Africans are Immigrants (2.5%, a difference of 0.020%), Cajun (2.5%, a difference of 0.070%), Sierra Leonean (2.5%, a difference of 0.12%), Immigrants from Sierra Leone (2.5%, a difference of 0.15%), and Immigrants from Oceania (2.5%, a difference of 0.16%).
| Demographics | Rating | Rank | Single Father Households |
| Americans | 9.3 /100 | #227 | Tragic 2.4% |
| Immigrants | Ghana | 9.1 /100 | #228 | Tragic 2.4% |
| Immigrants | Zaire | 8.6 /100 | #229 | Tragic 2.4% |
| Sub-Saharan Africans | 8.3 /100 | #230 | Tragic 2.4% |
| Immigrants | Nonimmigrants | 7.6 /100 | #231 | Tragic 2.4% |
| Pennsylvania Germans | 7.3 /100 | #232 | Tragic 2.4% |
| Immigrants | Western Africa | 7.0 /100 | #233 | Tragic 2.4% |
| Africans | 6.3 /100 | #234 | Tragic 2.5% |
| Immigrants | Immigrants | 6.3 /100 | #235 | Tragic 2.5% |
| Cajuns | 6.1 /100 | #236 | Tragic 2.5% |
| Sierra Leoneans | 5.9 /100 | #237 | Tragic 2.5% |
| Immigrants | Sierra Leone | 5.8 /100 | #238 | Tragic 2.5% |
| Immigrants | Oceania | 5.8 /100 | #239 | Tragic 2.5% |
| Immigrants | Dominica | 4.8 /100 | #240 | Tragic 2.5% |
| Portuguese | 4.1 /100 | #241 | Tragic 2.5% |