Blackfeet vs Immigrants from Romania Single Father Households
COMPARE
Blackfeet
Immigrants from Romania
Single Father Households
Single Father Households Comparison
Blackfeet
Immigrants from Romania
2.7%
SINGLE FATHER HOUSEHOLDS
0.0/ 100
METRIC RATING
291st/ 347
METRIC RANK
2.1%
SINGLE FATHER HOUSEHOLDS
99.8/ 100
METRIC RATING
69th/ 347
METRIC RANK
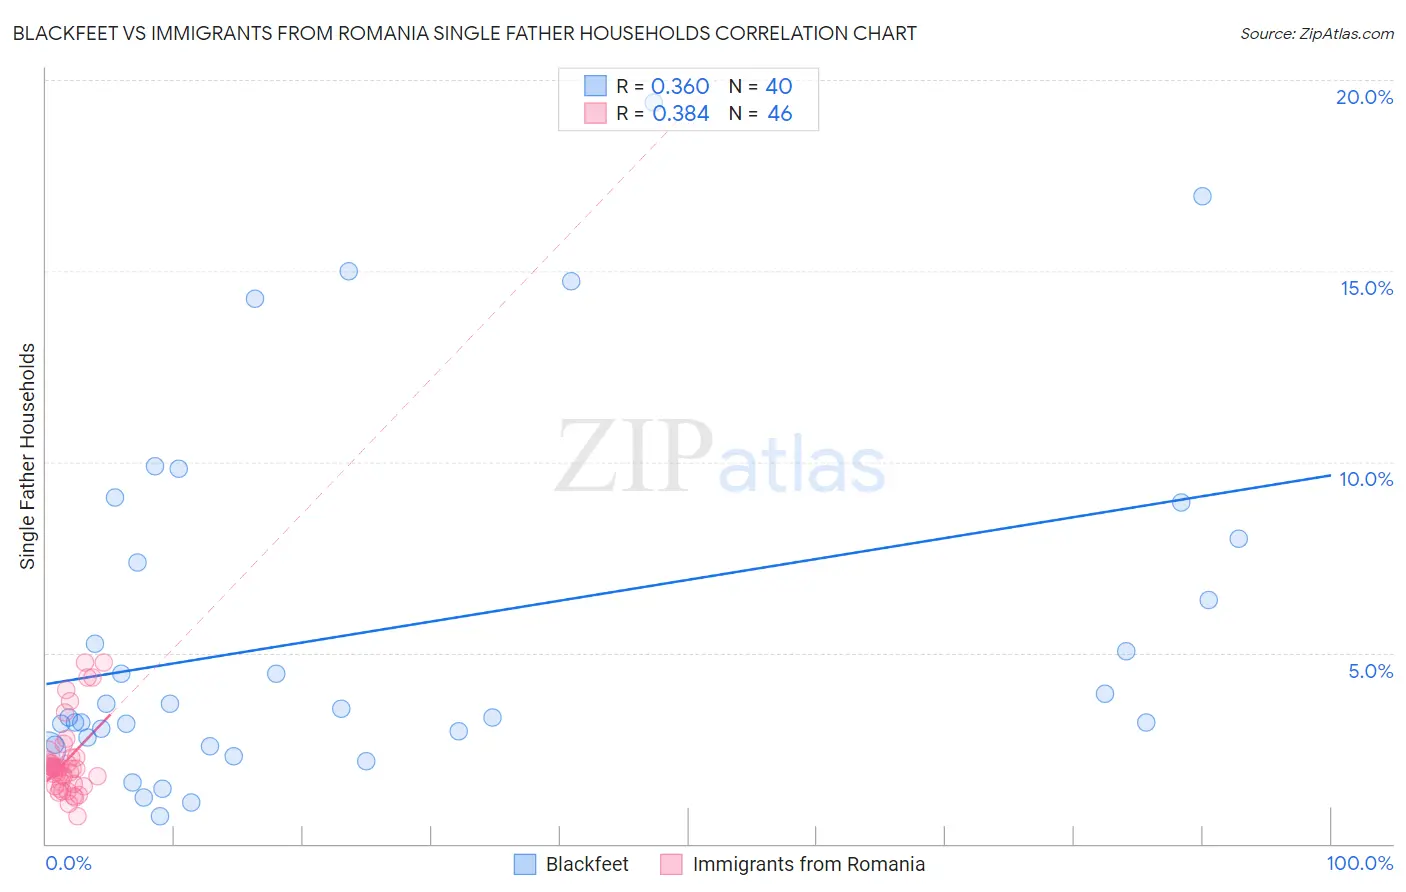
Blackfeet vs Immigrants from Romania Single Father Households Correlation Chart
The statistical analysis conducted on geographies consisting of 307,723,942 people shows a mild positive correlation between the proportion of Blackfeet and percentage of single father households in the United States with a correlation coefficient (R) of 0.360 and weighted average of 2.7%. Similarly, the statistical analysis conducted on geographies consisting of 255,577,760 people shows a mild positive correlation between the proportion of Immigrants from Romania and percentage of single father households in the United States with a correlation coefficient (R) of 0.384 and weighted average of 2.1%, a difference of 30.9%.
Single Father Households Correlation Summary
| Measurement | Blackfeet | Immigrants from Romania |
| Minimum | 0.71% | 0.71% |
| Maximum | 19.4% | 4.8% |
| Range | 18.7% | 4.1% |
| Mean | 5.6% | 2.2% |
| Median | 3.4% | 2.0% |
| Interquartile 25% (IQ1) | 2.7% | 1.6% |
| Interquartile 75% (IQ3) | 7.7% | 2.3% |
| Interquartile Range (IQR) | 5.0% | 0.71% |
| Standard Deviation (Sample) | 4.7% | 0.97% |
| Standard Deviation (Population) | 4.6% | 0.96% |
Similar Demographics by Single Father Households
Demographics Similar to Blackfeet by Single Father Households
In terms of single father households, the demographic groups most similar to Blackfeet are Choctaw (2.7%, a difference of 0.46%), Puget Sound Salish (2.7%, a difference of 0.56%), Immigrants from Fiji (2.7%, a difference of 0.62%), Tlingit-Haida (2.7%, a difference of 1.0%), and Malaysian (2.7%, a difference of 1.1%).
| Demographics | Rating | Rank | Single Father Households |
| Hawaiians | 0.1 /100 | #284 | Tragic 2.7% |
| Ottawa | 0.1 /100 | #285 | Tragic 2.7% |
| Immigrants | Cuba | 0.1 /100 | #286 | Tragic 2.7% |
| Central American Indians | 0.0 /100 | #287 | Tragic 2.7% |
| Immigrants | Cambodia | 0.0 /100 | #288 | Tragic 2.7% |
| Tlingit-Haida | 0.0 /100 | #289 | Tragic 2.7% |
| Puget Sound Salish | 0.0 /100 | #290 | Tragic 2.7% |
| Blackfeet | 0.0 /100 | #291 | Tragic 2.7% |
| Choctaw | 0.0 /100 | #292 | Tragic 2.7% |
| Immigrants | Fiji | 0.0 /100 | #293 | Tragic 2.7% |
| Malaysians | 0.0 /100 | #294 | Tragic 2.7% |
| Chickasaw | 0.0 /100 | #295 | Tragic 2.8% |
| Japanese | 0.0 /100 | #296 | Tragic 2.8% |
| Hondurans | 0.0 /100 | #297 | Tragic 2.8% |
| Cree | 0.0 /100 | #298 | Tragic 2.8% |
Demographics Similar to Immigrants from Romania by Single Father Households
In terms of single father households, the demographic groups most similar to Immigrants from Romania are Immigrants from Denmark (2.1%, a difference of 0.020%), Immigrants from Italy (2.1%, a difference of 0.11%), Immigrants from Western Asia (2.1%, a difference of 0.16%), Egyptian (2.1%, a difference of 0.21%), and Immigrants from Kuwait (2.1%, a difference of 0.22%).
| Demographics | Rating | Rank | Single Father Households |
| Immigrants | Malaysia | 99.9 /100 | #62 | Exceptional 2.0% |
| Maltese | 99.9 /100 | #63 | Exceptional 2.0% |
| Mongolians | 99.9 /100 | #64 | Exceptional 2.1% |
| Paraguayans | 99.9 /100 | #65 | Exceptional 2.1% |
| Immigrants | Western Asia | 99.8 /100 | #66 | Exceptional 2.1% |
| Immigrants | Italy | 99.8 /100 | #67 | Exceptional 2.1% |
| Immigrants | Denmark | 99.8 /100 | #68 | Exceptional 2.1% |
| Immigrants | Romania | 99.8 /100 | #69 | Exceptional 2.1% |
| Egyptians | 99.8 /100 | #70 | Exceptional 2.1% |
| Immigrants | Kuwait | 99.8 /100 | #71 | Exceptional 2.1% |
| Immigrants | Spain | 99.8 /100 | #72 | Exceptional 2.1% |
| Immigrants | Bangladesh | 99.8 /100 | #73 | Exceptional 2.1% |
| Immigrants | Egypt | 99.8 /100 | #74 | Exceptional 2.1% |
| Immigrants | Sweden | 99.8 /100 | #75 | Exceptional 2.1% |
| Immigrants | Scotland | 99.8 /100 | #76 | Exceptional 2.1% |