Blackfeet vs Immigrants from Congo 9th Grade
COMPARE
Blackfeet
Immigrants from Congo
9th Grade
9th Grade Comparison
Blackfeet
Immigrants from Congo
95.0%
9TH GRADE
62.6/ 100
METRIC RATING
165th/ 347
METRIC RANK
93.9%
9TH GRADE
0.4/ 100
METRIC RATING
264th/ 347
METRIC RANK
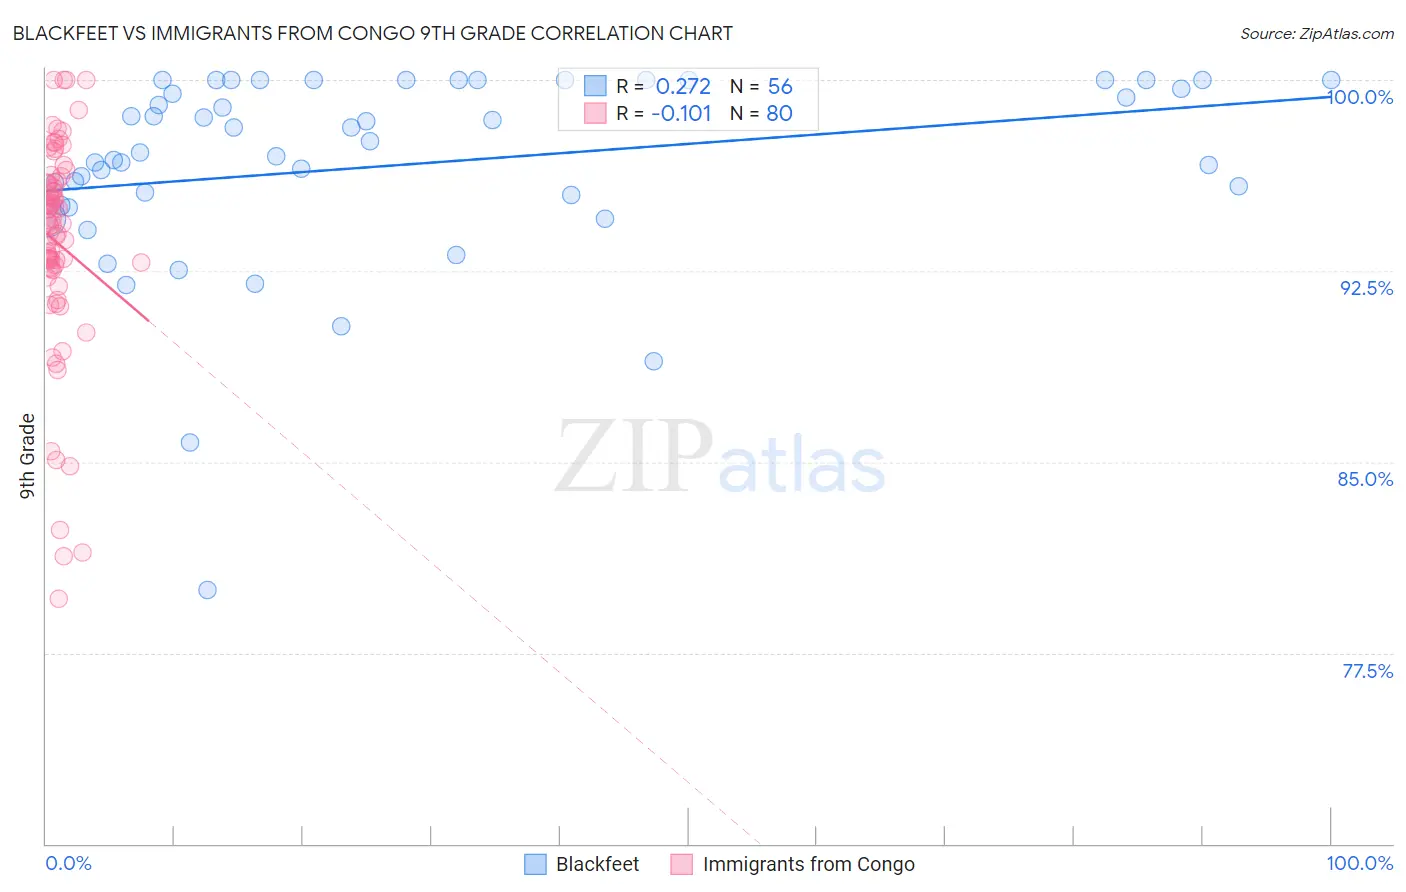
Blackfeet vs Immigrants from Congo 9th Grade Correlation Chart
The statistical analysis conducted on geographies consisting of 309,582,133 people shows a weak positive correlation between the proportion of Blackfeet and percentage of population with at least 9th grade education in the United States with a correlation coefficient (R) of 0.272 and weighted average of 95.0%. Similarly, the statistical analysis conducted on geographies consisting of 92,132,988 people shows a poor negative correlation between the proportion of Immigrants from Congo and percentage of population with at least 9th grade education in the United States with a correlation coefficient (R) of -0.101 and weighted average of 93.9%, a difference of 1.1%.
9th Grade Correlation Summary
| Measurement | Blackfeet | Immigrants from Congo |
| Minimum | 80.0% | 79.6% |
| Maximum | 100.0% | 100.0% |
| Range | 20.0% | 20.4% |
| Mean | 96.7% | 93.6% |
| Median | 97.4% | 94.4% |
| Interquartile 25% (IQ1) | 95.3% | 92.6% |
| Interquartile 75% (IQ3) | 100.0% | 96.0% |
| Interquartile Range (IQR) | 4.7% | 3.4% |
| Standard Deviation (Sample) | 3.9% | 4.2% |
| Standard Deviation (Population) | 3.9% | 4.2% |
Similar Demographics by 9th Grade
Demographics Similar to Blackfeet by 9th Grade
In terms of 9th grade, the demographic groups most similar to Blackfeet are Ute (95.0%, a difference of 0.0%), Pakistani (95.0%, a difference of 0.010%), Venezuelan (95.0%, a difference of 0.010%), Immigrants from Brazil (95.0%, a difference of 0.010%), and Chilean (95.0%, a difference of 0.020%).
| Demographics | Rating | Rank | 9th Grade |
| Egyptians | 70.1 /100 | #158 | Good 95.0% |
| Immigrants | Ukraine | 67.4 /100 | #159 | Good 95.0% |
| Immigrants | Italy | 66.6 /100 | #160 | Good 95.0% |
| French American Indians | 66.5 /100 | #161 | Good 95.0% |
| Bermudans | 65.8 /100 | #162 | Good 95.0% |
| Pakistanis | 64.1 /100 | #163 | Good 95.0% |
| Venezuelans | 63.6 /100 | #164 | Good 95.0% |
| Blackfeet | 62.6 /100 | #165 | Good 95.0% |
| Ute | 62.6 /100 | #166 | Good 95.0% |
| Immigrants | Brazil | 61.1 /100 | #167 | Good 95.0% |
| Chileans | 60.7 /100 | #168 | Good 95.0% |
| Spaniards | 59.6 /100 | #169 | Average 94.9% |
| Alsatians | 58.6 /100 | #170 | Average 94.9% |
| Colville | 58.5 /100 | #171 | Average 94.9% |
| Iraqis | 54.0 /100 | #172 | Average 94.9% |
Demographics Similar to Immigrants from Congo by 9th Grade
In terms of 9th grade, the demographic groups most similar to Immigrants from Congo are Immigrants from Uzbekistan (93.9%, a difference of 0.0%), Native/Alaskan (93.9%, a difference of 0.0%), Immigrants from Jamaica (93.9%, a difference of 0.010%), Navajo (93.9%, a difference of 0.010%), and South American (93.9%, a difference of 0.030%).
| Demographics | Rating | Rank | 9th Grade |
| Immigrants | Costa Rica | 0.5 /100 | #257 | Tragic 94.0% |
| Immigrants | Thailand | 0.5 /100 | #258 | Tragic 93.9% |
| Ghanaians | 0.5 /100 | #259 | Tragic 93.9% |
| Pima | 0.4 /100 | #260 | Tragic 93.9% |
| South Americans | 0.4 /100 | #261 | Tragic 93.9% |
| Immigrants | Jamaica | 0.4 /100 | #262 | Tragic 93.9% |
| Immigrants | Uzbekistan | 0.4 /100 | #263 | Tragic 93.9% |
| Immigrants | Congo | 0.4 /100 | #264 | Tragic 93.9% |
| Natives/Alaskans | 0.4 /100 | #265 | Tragic 93.9% |
| Navajo | 0.3 /100 | #266 | Tragic 93.9% |
| Armenians | 0.3 /100 | #267 | Tragic 93.9% |
| Immigrants | Bolivia | 0.3 /100 | #268 | Tragic 93.9% |
| Immigrants | Uruguay | 0.2 /100 | #269 | Tragic 93.8% |
| Yuman | 0.2 /100 | #270 | Tragic 93.8% |
| Immigrants | Ghana | 0.2 /100 | #271 | Tragic 93.8% |