Blackfeet vs Ethiopian Single Father Households
COMPARE
Blackfeet
Ethiopian
Single Father Households
Single Father Households Comparison
Blackfeet
Ethiopians
2.7%
SINGLE FATHER HOUSEHOLDS
0.0/ 100
METRIC RATING
291st/ 347
METRIC RANK
2.4%
SINGLE FATHER HOUSEHOLDS
16.6/ 100
METRIC RATING
214th/ 347
METRIC RANK
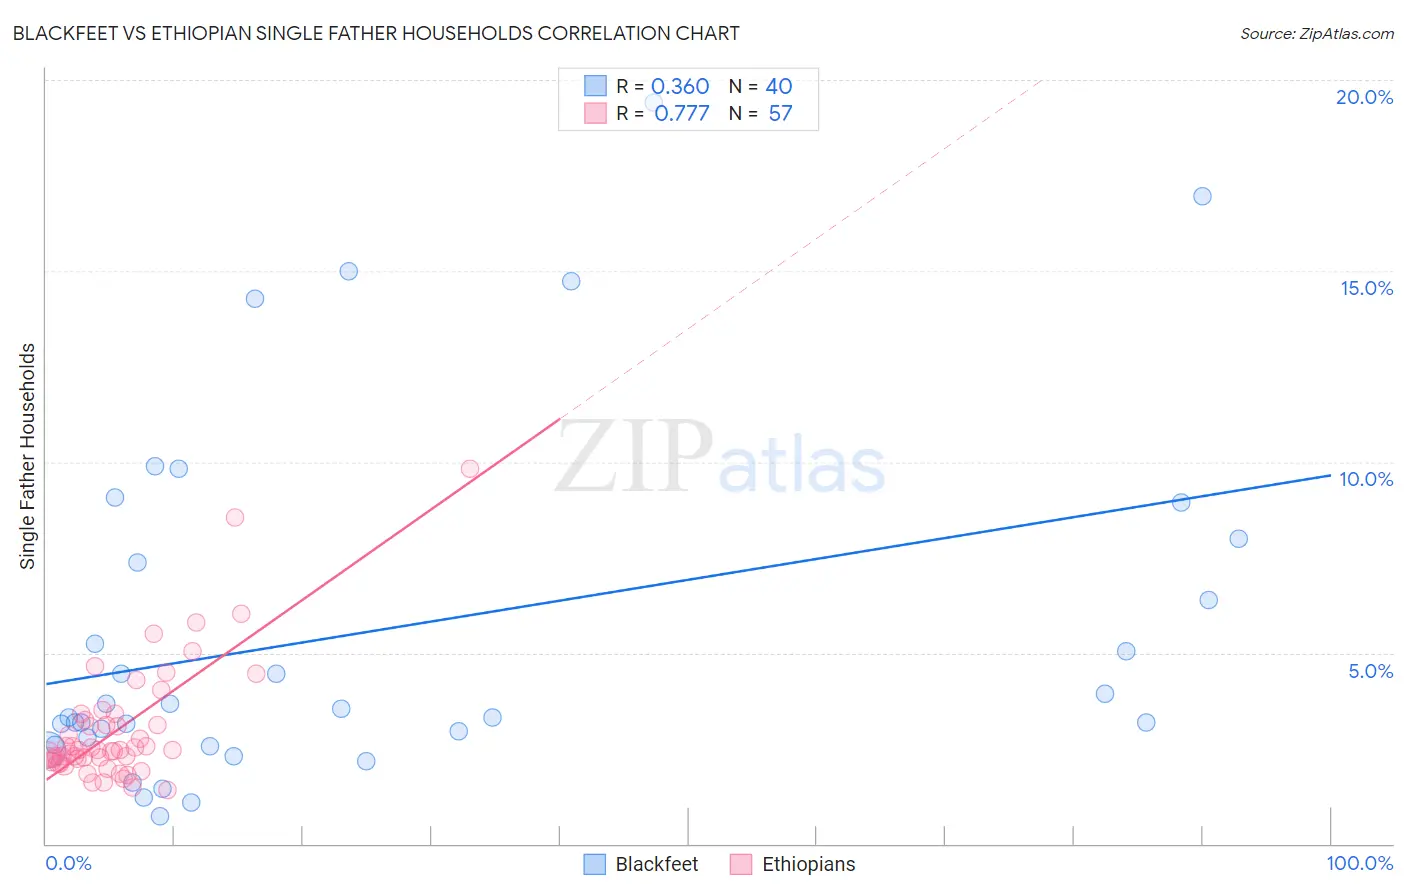
Blackfeet vs Ethiopian Single Father Households Correlation Chart
The statistical analysis conducted on geographies consisting of 307,723,942 people shows a mild positive correlation between the proportion of Blackfeet and percentage of single father households in the United States with a correlation coefficient (R) of 0.360 and weighted average of 2.7%. Similarly, the statistical analysis conducted on geographies consisting of 222,457,942 people shows a strong positive correlation between the proportion of Ethiopians and percentage of single father households in the United States with a correlation coefficient (R) of 0.777 and weighted average of 2.4%, a difference of 12.2%.
Single Father Households Correlation Summary
| Measurement | Blackfeet | Ethiopian |
| Minimum | 0.71% | 1.4% |
| Maximum | 19.4% | 9.8% |
| Range | 18.7% | 8.4% |
| Mean | 5.6% | 3.0% |
| Median | 3.4% | 2.4% |
| Interquartile 25% (IQ1) | 2.7% | 2.2% |
| Interquartile 75% (IQ3) | 7.7% | 3.3% |
| Interquartile Range (IQR) | 5.0% | 1.1% |
| Standard Deviation (Sample) | 4.7% | 1.6% |
| Standard Deviation (Population) | 4.6% | 1.6% |
Similar Demographics by Single Father Households
Demographics Similar to Blackfeet by Single Father Households
In terms of single father households, the demographic groups most similar to Blackfeet are Choctaw (2.7%, a difference of 0.46%), Puget Sound Salish (2.7%, a difference of 0.56%), Immigrants from Fiji (2.7%, a difference of 0.62%), Tlingit-Haida (2.7%, a difference of 1.0%), and Malaysian (2.7%, a difference of 1.1%).
| Demographics | Rating | Rank | Single Father Households |
| Hawaiians | 0.1 /100 | #284 | Tragic 2.7% |
| Ottawa | 0.1 /100 | #285 | Tragic 2.7% |
| Immigrants | Cuba | 0.1 /100 | #286 | Tragic 2.7% |
| Central American Indians | 0.0 /100 | #287 | Tragic 2.7% |
| Immigrants | Cambodia | 0.0 /100 | #288 | Tragic 2.7% |
| Tlingit-Haida | 0.0 /100 | #289 | Tragic 2.7% |
| Puget Sound Salish | 0.0 /100 | #290 | Tragic 2.7% |
| Blackfeet | 0.0 /100 | #291 | Tragic 2.7% |
| Choctaw | 0.0 /100 | #292 | Tragic 2.7% |
| Immigrants | Fiji | 0.0 /100 | #293 | Tragic 2.7% |
| Malaysians | 0.0 /100 | #294 | Tragic 2.7% |
| Chickasaw | 0.0 /100 | #295 | Tragic 2.8% |
| Japanese | 0.0 /100 | #296 | Tragic 2.8% |
| Hondurans | 0.0 /100 | #297 | Tragic 2.8% |
| Cree | 0.0 /100 | #298 | Tragic 2.8% |
Demographics Similar to Ethiopians by Single Father Households
In terms of single father households, the demographic groups most similar to Ethiopians are Norwegian (2.4%, a difference of 0.060%), Immigrants from South Eastern Asia (2.4%, a difference of 0.090%), Finnish (2.4%, a difference of 0.21%), Immigrants from Ecuador (2.4%, a difference of 0.23%), and Immigrants from Nigeria (2.4%, a difference of 0.26%).
| Demographics | Rating | Rank | Single Father Households |
| Whites/Caucasians | 22.6 /100 | #207 | Fair 2.4% |
| Immigrants | Kenya | 20.3 /100 | #208 | Fair 2.4% |
| Immigrants | Peru | 19.3 /100 | #209 | Poor 2.4% |
| Immigrants | Costa Rica | 19.2 /100 | #210 | Poor 2.4% |
| Immigrants | Nigeria | 18.7 /100 | #211 | Poor 2.4% |
| Finns | 18.3 /100 | #212 | Poor 2.4% |
| Norwegians | 17.1 /100 | #213 | Poor 2.4% |
| Ethiopians | 16.6 /100 | #214 | Poor 2.4% |
| Immigrants | South Eastern Asia | 15.9 /100 | #215 | Poor 2.4% |
| Immigrants | Ecuador | 14.9 /100 | #216 | Poor 2.4% |
| Dutch | 14.3 /100 | #217 | Poor 2.4% |
| Immigrants | Ethiopia | 13.4 /100 | #218 | Poor 2.4% |
| Sudanese | 13.0 /100 | #219 | Poor 2.4% |
| Ghanaians | 12.9 /100 | #220 | Poor 2.4% |
| Immigrants | Burma/Myanmar | 12.1 /100 | #221 | Poor 2.4% |