Ethiopian vs Immigrants from Congo Single Father Households
COMPARE
Ethiopian
Immigrants from Congo
Single Father Households
Single Father Households Comparison
Ethiopians
Immigrants from Congo
2.4%
SINGLE FATHER HOUSEHOLDS
16.6/ 100
METRIC RATING
214th/ 347
METRIC RANK
2.5%
SINGLE FATHER HOUSEHOLDS
1.2/ 100
METRIC RATING
257th/ 347
METRIC RANK
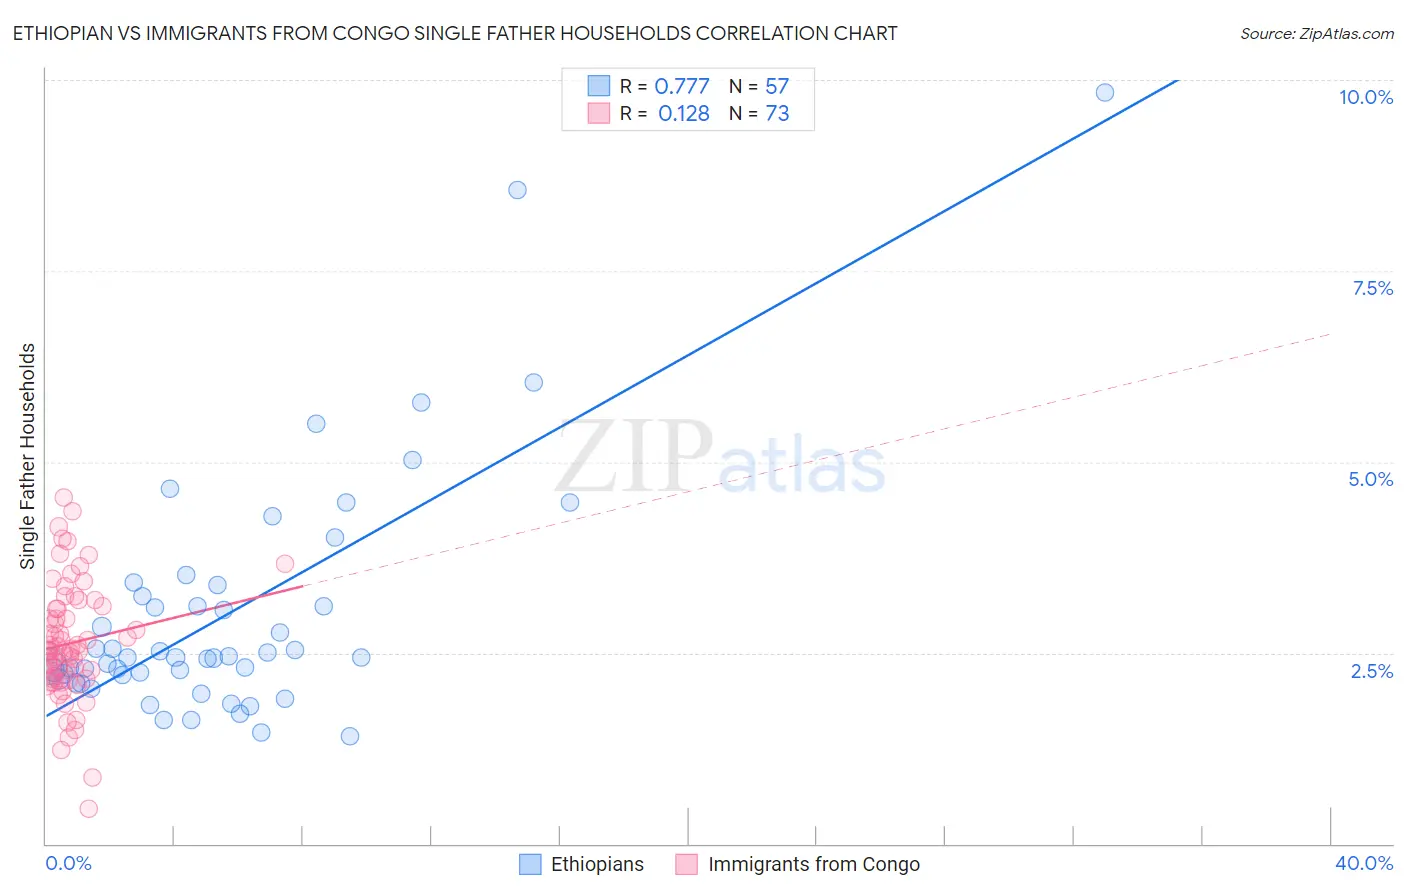
Ethiopian vs Immigrants from Congo Single Father Households Correlation Chart
The statistical analysis conducted on geographies consisting of 222,457,942 people shows a strong positive correlation between the proportion of Ethiopians and percentage of single father households in the United States with a correlation coefficient (R) of 0.777 and weighted average of 2.4%. Similarly, the statistical analysis conducted on geographies consisting of 91,926,363 people shows a poor positive correlation between the proportion of Immigrants from Congo and percentage of single father households in the United States with a correlation coefficient (R) of 0.128 and weighted average of 2.5%, a difference of 5.0%.
Single Father Households Correlation Summary
| Measurement | Ethiopian | Immigrants from Congo |
| Minimum | 1.4% | 0.46% |
| Maximum | 9.8% | 4.5% |
| Range | 8.4% | 4.1% |
| Mean | 3.0% | 2.6% |
| Median | 2.4% | 2.5% |
| Interquartile 25% (IQ1) | 2.2% | 2.2% |
| Interquartile 75% (IQ3) | 3.3% | 3.1% |
| Interquartile Range (IQR) | 1.1% | 0.93% |
| Standard Deviation (Sample) | 1.6% | 0.77% |
| Standard Deviation (Population) | 1.6% | 0.76% |
Similar Demographics by Single Father Households
Demographics Similar to Ethiopians by Single Father Households
In terms of single father households, the demographic groups most similar to Ethiopians are Norwegian (2.4%, a difference of 0.060%), Immigrants from South Eastern Asia (2.4%, a difference of 0.090%), Finnish (2.4%, a difference of 0.21%), Immigrants from Ecuador (2.4%, a difference of 0.23%), and Immigrants from Nigeria (2.4%, a difference of 0.26%).
| Demographics | Rating | Rank | Single Father Households |
| Whites/Caucasians | 22.6 /100 | #207 | Fair 2.4% |
| Immigrants | Kenya | 20.3 /100 | #208 | Fair 2.4% |
| Immigrants | Peru | 19.3 /100 | #209 | Poor 2.4% |
| Immigrants | Costa Rica | 19.2 /100 | #210 | Poor 2.4% |
| Immigrants | Nigeria | 18.7 /100 | #211 | Poor 2.4% |
| Finns | 18.3 /100 | #212 | Poor 2.4% |
| Norwegians | 17.1 /100 | #213 | Poor 2.4% |
| Ethiopians | 16.6 /100 | #214 | Poor 2.4% |
| Immigrants | South Eastern Asia | 15.9 /100 | #215 | Poor 2.4% |
| Immigrants | Ecuador | 14.9 /100 | #216 | Poor 2.4% |
| Dutch | 14.3 /100 | #217 | Poor 2.4% |
| Immigrants | Ethiopia | 13.4 /100 | #218 | Poor 2.4% |
| Sudanese | 13.0 /100 | #219 | Poor 2.4% |
| Ghanaians | 12.9 /100 | #220 | Poor 2.4% |
| Immigrants | Burma/Myanmar | 12.1 /100 | #221 | Poor 2.4% |
Demographics Similar to Immigrants from Congo by Single Father Households
In terms of single father households, the demographic groups most similar to Immigrants from Congo are Spanish (2.5%, a difference of 0.090%), Comanche (2.5%, a difference of 0.24%), Potawatomi (2.5%, a difference of 0.29%), Immigrants from Caribbean (2.5%, a difference of 0.33%), and Tongan (2.5%, a difference of 0.34%).
| Demographics | Rating | Rank | Single Father Households |
| Somalis | 2.1 /100 | #250 | Tragic 2.5% |
| Liberians | 2.0 /100 | #251 | Tragic 2.5% |
| Immigrants | Eritrea | 2.0 /100 | #252 | Tragic 2.5% |
| Immigrants | Somalia | 1.9 /100 | #253 | Tragic 2.5% |
| Immigrants | Thailand | 1.8 /100 | #254 | Tragic 2.5% |
| Tongans | 1.5 /100 | #255 | Tragic 2.5% |
| Potawatomi | 1.4 /100 | #256 | Tragic 2.5% |
| Immigrants | Congo | 1.2 /100 | #257 | Tragic 2.5% |
| Spanish | 1.1 /100 | #258 | Tragic 2.5% |
| Comanche | 1.0 /100 | #259 | Tragic 2.5% |
| Immigrants | Caribbean | 1.0 /100 | #260 | Tragic 2.5% |
| Immigrants | Belize | 0.9 /100 | #261 | Tragic 2.5% |
| Immigrants | Liberia | 0.8 /100 | #262 | Tragic 2.5% |
| Dominicans | 0.8 /100 | #263 | Tragic 2.5% |
| Indonesians | 0.5 /100 | #264 | Tragic 2.6% |