Apache vs Immigrants from Congo Single Father Households
COMPARE
Apache
Immigrants from Congo
Single Father Households
Single Father Households Comparison
Apache
Immigrants from Congo
2.8%
SINGLE FATHER HOUSEHOLDS
0.0/ 100
METRIC RATING
308th/ 347
METRIC RANK
2.5%
SINGLE FATHER HOUSEHOLDS
1.2/ 100
METRIC RATING
257th/ 347
METRIC RANK
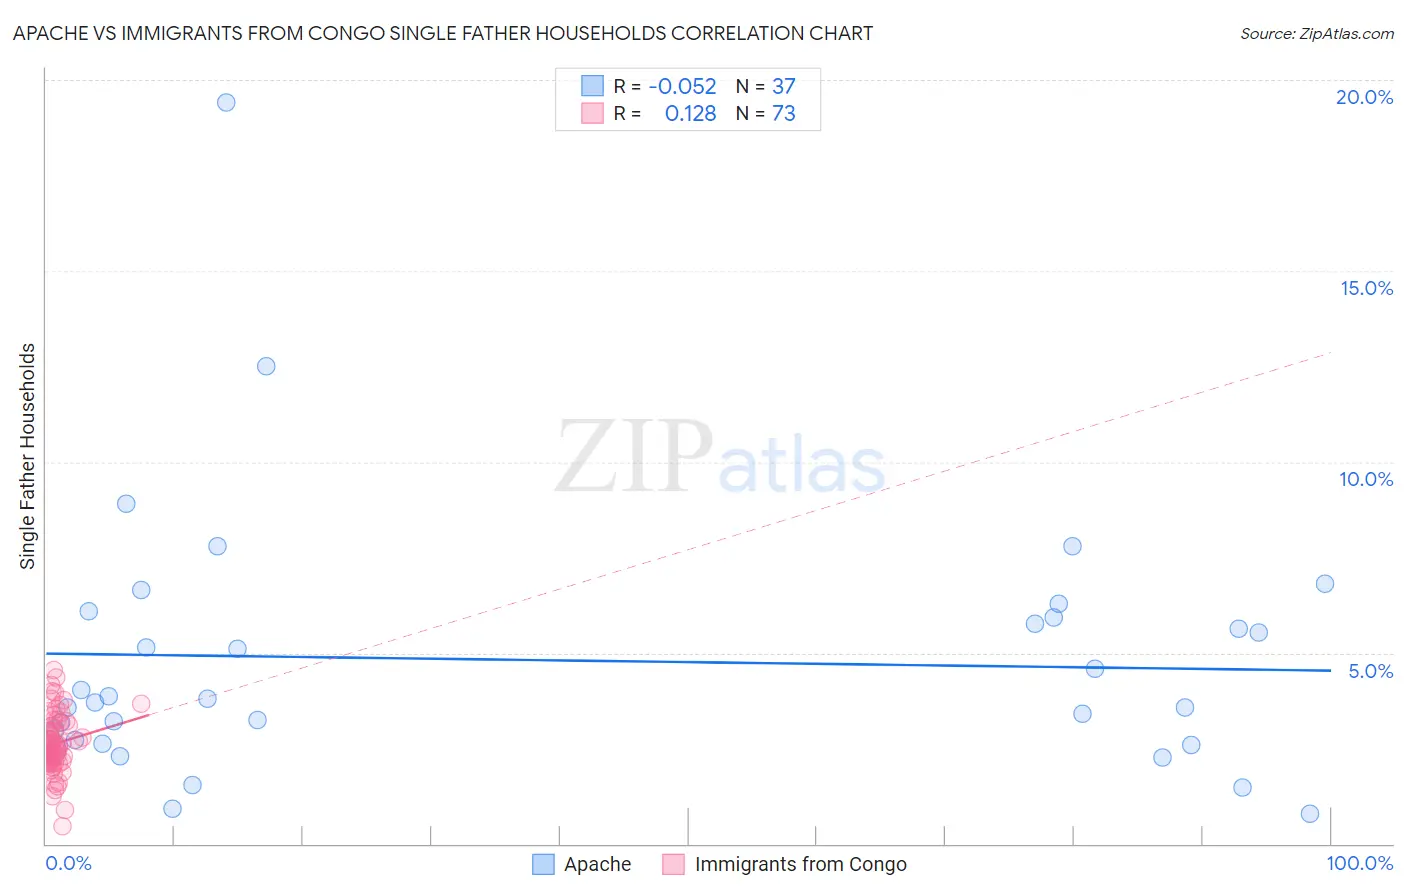
Apache vs Immigrants from Congo Single Father Households Correlation Chart
The statistical analysis conducted on geographies consisting of 230,074,281 people shows a slight negative correlation between the proportion of Apache and percentage of single father households in the United States with a correlation coefficient (R) of -0.052 and weighted average of 2.8%. Similarly, the statistical analysis conducted on geographies consisting of 91,926,363 people shows a poor positive correlation between the proportion of Immigrants from Congo and percentage of single father households in the United States with a correlation coefficient (R) of 0.128 and weighted average of 2.5%, a difference of 12.1%.
Single Father Households Correlation Summary
| Measurement | Apache | Immigrants from Congo |
| Minimum | 0.80% | 0.46% |
| Maximum | 19.4% | 4.5% |
| Range | 18.6% | 4.1% |
| Mean | 4.8% | 2.6% |
| Median | 3.8% | 2.5% |
| Interquartile 25% (IQ1) | 2.7% | 2.2% |
| Interquartile 75% (IQ3) | 6.0% | 3.1% |
| Interquartile Range (IQR) | 3.3% | 0.93% |
| Standard Deviation (Sample) | 3.4% | 0.77% |
| Standard Deviation (Population) | 3.4% | 0.76% |
Similar Demographics by Single Father Households
Demographics Similar to Apache by Single Father Households
In terms of single father households, the demographic groups most similar to Apache are Hopi (2.8%, a difference of 0.18%), Immigrants from the Azores (2.8%, a difference of 0.35%), Hispanic or Latino (2.8%, a difference of 0.50%), Mexican American Indian (2.8%, a difference of 0.66%), and Central American (2.9%, a difference of 0.71%).
| Demographics | Rating | Rank | Single Father Households |
| Immigrants | Latin America | 0.0 /100 | #301 | Tragic 2.8% |
| Spanish Americans | 0.0 /100 | #302 | Tragic 2.8% |
| Immigrants | Honduras | 0.0 /100 | #303 | Tragic 2.8% |
| Mexican American Indians | 0.0 /100 | #304 | Tragic 2.8% |
| Hispanics or Latinos | 0.0 /100 | #305 | Tragic 2.8% |
| Immigrants | Azores | 0.0 /100 | #306 | Tragic 2.8% |
| Hopi | 0.0 /100 | #307 | Tragic 2.8% |
| Apache | 0.0 /100 | #308 | Tragic 2.8% |
| Central Americans | 0.0 /100 | #309 | Tragic 2.9% |
| Immigrants | Laos | 0.0 /100 | #310 | Tragic 2.9% |
| Spanish American Indians | 0.0 /100 | #311 | Tragic 2.9% |
| Tsimshian | 0.0 /100 | #312 | Tragic 2.9% |
| Arapaho | 0.0 /100 | #313 | Tragic 2.9% |
| Salvadorans | 0.0 /100 | #314 | Tragic 2.9% |
| Cheyenne | 0.0 /100 | #315 | Tragic 2.9% |
Demographics Similar to Immigrants from Congo by Single Father Households
In terms of single father households, the demographic groups most similar to Immigrants from Congo are Spanish (2.5%, a difference of 0.090%), Comanche (2.5%, a difference of 0.24%), Potawatomi (2.5%, a difference of 0.29%), Immigrants from Caribbean (2.5%, a difference of 0.33%), and Tongan (2.5%, a difference of 0.34%).
| Demographics | Rating | Rank | Single Father Households |
| Somalis | 2.1 /100 | #250 | Tragic 2.5% |
| Liberians | 2.0 /100 | #251 | Tragic 2.5% |
| Immigrants | Eritrea | 2.0 /100 | #252 | Tragic 2.5% |
| Immigrants | Somalia | 1.9 /100 | #253 | Tragic 2.5% |
| Immigrants | Thailand | 1.8 /100 | #254 | Tragic 2.5% |
| Tongans | 1.5 /100 | #255 | Tragic 2.5% |
| Potawatomi | 1.4 /100 | #256 | Tragic 2.5% |
| Immigrants | Congo | 1.2 /100 | #257 | Tragic 2.5% |
| Spanish | 1.1 /100 | #258 | Tragic 2.5% |
| Comanche | 1.0 /100 | #259 | Tragic 2.5% |
| Immigrants | Caribbean | 1.0 /100 | #260 | Tragic 2.5% |
| Immigrants | Belize | 0.9 /100 | #261 | Tragic 2.5% |
| Immigrants | Liberia | 0.8 /100 | #262 | Tragic 2.5% |
| Dominicans | 0.8 /100 | #263 | Tragic 2.5% |
| Indonesians | 0.5 /100 | #264 | Tragic 2.6% |