Blackfeet vs Immigrants from Belarus Single Father Households
COMPARE
Blackfeet
Immigrants from Belarus
Single Father Households
Single Father Households Comparison
Blackfeet
Immigrants from Belarus
2.7%
SINGLE FATHER HOUSEHOLDS
0.0/ 100
METRIC RATING
291st/ 347
METRIC RANK
1.9%
SINGLE FATHER HOUSEHOLDS
100.0/ 100
METRIC RATING
11th/ 347
METRIC RANK
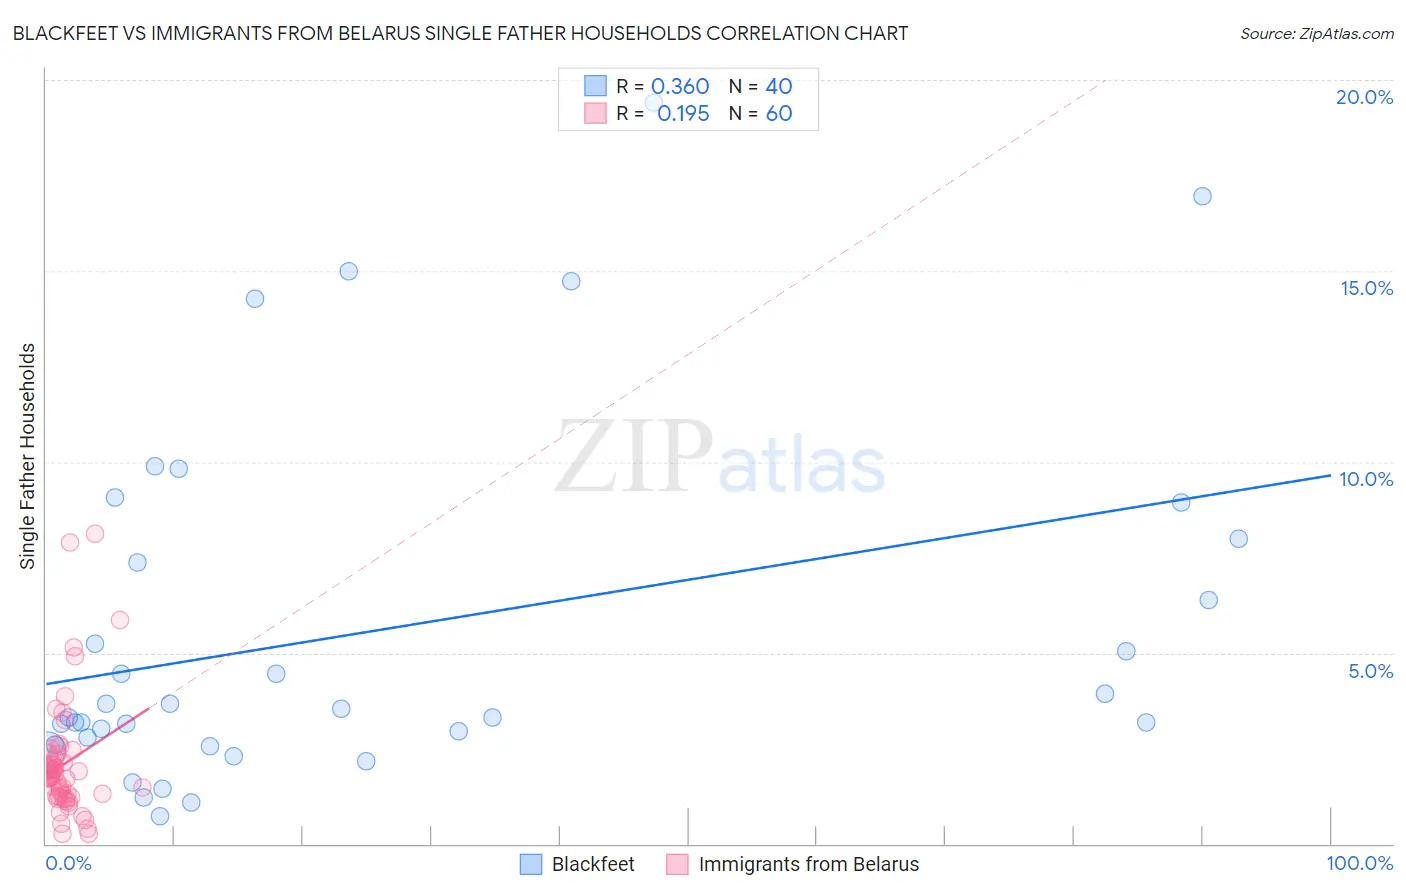
Blackfeet vs Immigrants from Belarus Single Father Households Correlation Chart
The statistical analysis conducted on geographies consisting of 307,723,942 people shows a mild positive correlation between the proportion of Blackfeet and percentage of single father households in the United States with a correlation coefficient (R) of 0.360 and weighted average of 2.7%. Similarly, the statistical analysis conducted on geographies consisting of 149,894,019 people shows a poor positive correlation between the proportion of Immigrants from Belarus and percentage of single father households in the United States with a correlation coefficient (R) of 0.195 and weighted average of 1.9%, a difference of 45.4%.
Single Father Households Correlation Summary
| Measurement | Blackfeet | Immigrants from Belarus |
| Minimum | 0.71% | 0.25% |
| Maximum | 19.4% | 8.1% |
| Range | 18.7% | 7.9% |
| Mean | 5.6% | 2.1% |
| Median | 3.4% | 1.8% |
| Interquartile 25% (IQ1) | 2.7% | 1.2% |
| Interquartile 75% (IQ3) | 7.7% | 2.3% |
| Interquartile Range (IQR) | 5.0% | 1.0% |
| Standard Deviation (Sample) | 4.7% | 1.5% |
| Standard Deviation (Population) | 4.6% | 1.5% |
Similar Demographics by Single Father Households
Demographics Similar to Blackfeet by Single Father Households
In terms of single father households, the demographic groups most similar to Blackfeet are Choctaw (2.7%, a difference of 0.46%), Puget Sound Salish (2.7%, a difference of 0.56%), Immigrants from Fiji (2.7%, a difference of 0.62%), Tlingit-Haida (2.7%, a difference of 1.0%), and Malaysian (2.7%, a difference of 1.1%).
| Demographics | Rating | Rank | Single Father Households |
| Hawaiians | 0.1 /100 | #284 | Tragic 2.7% |
| Ottawa | 0.1 /100 | #285 | Tragic 2.7% |
| Immigrants | Cuba | 0.1 /100 | #286 | Tragic 2.7% |
| Central American Indians | 0.0 /100 | #287 | Tragic 2.7% |
| Immigrants | Cambodia | 0.0 /100 | #288 | Tragic 2.7% |
| Tlingit-Haida | 0.0 /100 | #289 | Tragic 2.7% |
| Puget Sound Salish | 0.0 /100 | #290 | Tragic 2.7% |
| Blackfeet | 0.0 /100 | #291 | Tragic 2.7% |
| Choctaw | 0.0 /100 | #292 | Tragic 2.7% |
| Immigrants | Fiji | 0.0 /100 | #293 | Tragic 2.7% |
| Malaysians | 0.0 /100 | #294 | Tragic 2.7% |
| Chickasaw | 0.0 /100 | #295 | Tragic 2.8% |
| Japanese | 0.0 /100 | #296 | Tragic 2.8% |
| Hondurans | 0.0 /100 | #297 | Tragic 2.8% |
| Cree | 0.0 /100 | #298 | Tragic 2.8% |
Demographics Similar to Immigrants from Belarus by Single Father Households
In terms of single father households, the demographic groups most similar to Immigrants from Belarus are Okinawan (1.9%, a difference of 0.32%), Immigrants from Greece (1.9%, a difference of 0.44%), Immigrants from Singapore (1.9%, a difference of 0.47%), Immigrants from China (1.8%, a difference of 0.68%), and Immigrants from Ireland (1.8%, a difference of 0.82%).
| Demographics | Rating | Rank | Single Father Households |
| Immigrants | Uzbekistan | 100.0 /100 | #4 | Exceptional 1.8% |
| Immigrants | Hong Kong | 100.0 /100 | #5 | Exceptional 1.8% |
| Immigrants | Taiwan | 100.0 /100 | #6 | Exceptional 1.8% |
| Cypriots | 100.0 /100 | #7 | Exceptional 1.8% |
| Immigrants | Ireland | 100.0 /100 | #8 | Exceptional 1.8% |
| Immigrants | China | 100.0 /100 | #9 | Exceptional 1.8% |
| Okinawans | 100.0 /100 | #10 | Exceptional 1.9% |
| Immigrants | Belarus | 100.0 /100 | #11 | Exceptional 1.9% |
| Immigrants | Greece | 100.0 /100 | #12 | Exceptional 1.9% |
| Immigrants | Singapore | 100.0 /100 | #13 | Exceptional 1.9% |
| Immigrants | Lithuania | 100.0 /100 | #14 | Exceptional 1.9% |
| Immigrants | Eastern Asia | 100.0 /100 | #15 | Exceptional 1.9% |
| Immigrants | Iran | 100.0 /100 | #16 | Exceptional 1.9% |
| Immigrants | India | 100.0 /100 | #17 | Exceptional 1.9% |
| Indians (Asian) | 100.0 /100 | #18 | Exceptional 1.9% |