Blackfeet vs Immigrants from Bulgaria Single Father Households
COMPARE
Blackfeet
Immigrants from Bulgaria
Single Father Households
Single Father Households Comparison
Blackfeet
Immigrants from Bulgaria
2.7%
SINGLE FATHER HOUSEHOLDS
0.0/ 100
METRIC RATING
291st/ 347
METRIC RANK
2.0%
SINGLE FATHER HOUSEHOLDS
100.0/ 100
METRIC RATING
40th/ 347
METRIC RANK
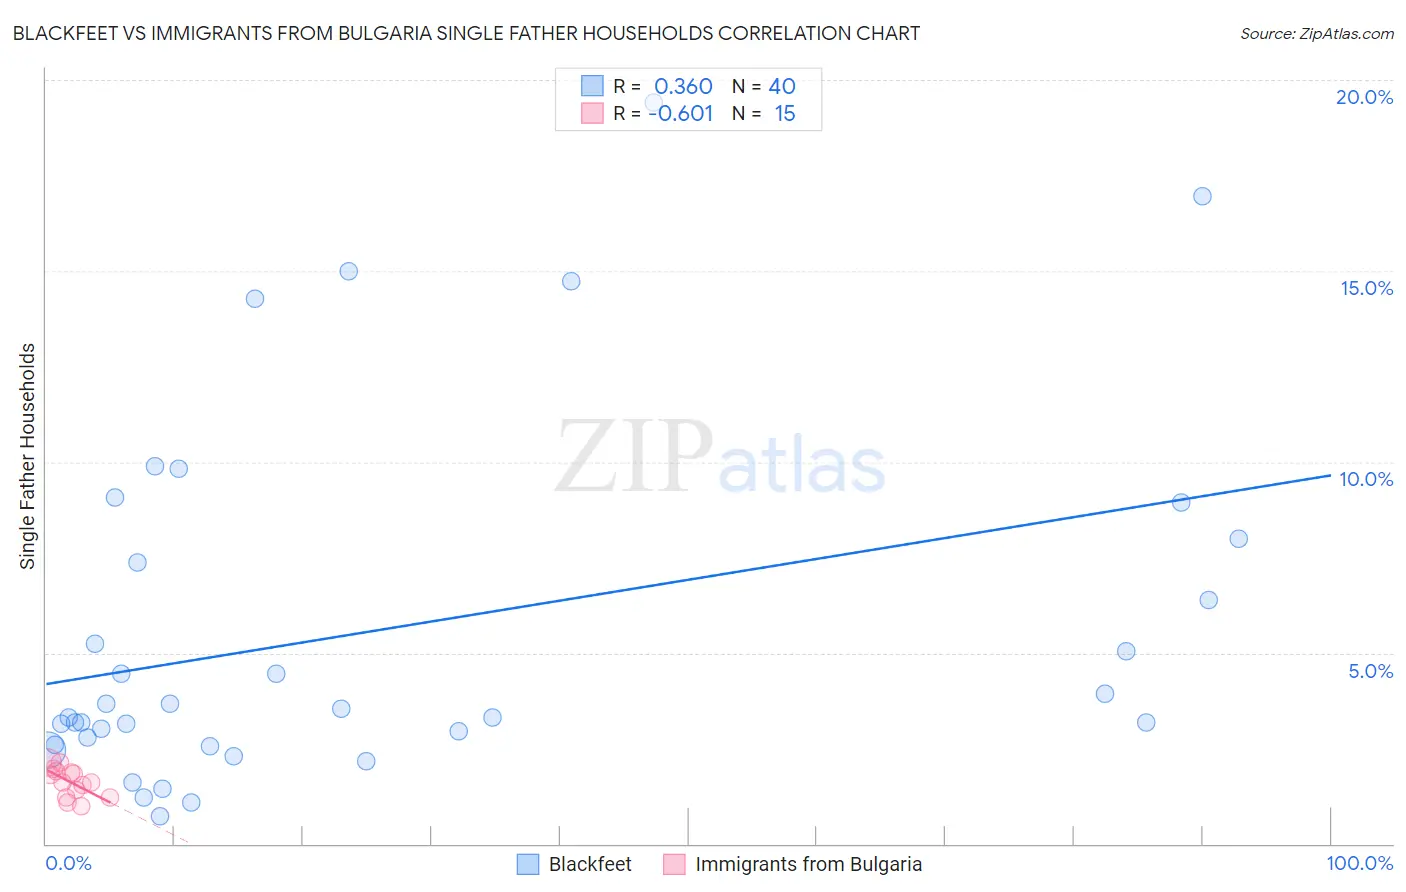
Blackfeet vs Immigrants from Bulgaria Single Father Households Correlation Chart
The statistical analysis conducted on geographies consisting of 307,723,942 people shows a mild positive correlation between the proportion of Blackfeet and percentage of single father households in the United States with a correlation coefficient (R) of 0.360 and weighted average of 2.7%. Similarly, the statistical analysis conducted on geographies consisting of 172,048,357 people shows a significant negative correlation between the proportion of Immigrants from Bulgaria and percentage of single father households in the United States with a correlation coefficient (R) of -0.601 and weighted average of 2.0%, a difference of 35.6%.
Single Father Households Correlation Summary
| Measurement | Blackfeet | Immigrants from Bulgaria |
| Minimum | 0.71% | 0.98% |
| Maximum | 19.4% | 2.1% |
| Range | 18.7% | 1.1% |
| Mean | 5.6% | 1.6% |
| Median | 3.4% | 1.6% |
| Interquartile 25% (IQ1) | 2.7% | 1.2% |
| Interquartile 75% (IQ3) | 7.7% | 1.9% |
| Interquartile Range (IQR) | 5.0% | 0.70% |
| Standard Deviation (Sample) | 4.7% | 0.37% |
| Standard Deviation (Population) | 4.6% | 0.36% |
Similar Demographics by Single Father Households
Demographics Similar to Blackfeet by Single Father Households
In terms of single father households, the demographic groups most similar to Blackfeet are Choctaw (2.7%, a difference of 0.46%), Puget Sound Salish (2.7%, a difference of 0.56%), Immigrants from Fiji (2.7%, a difference of 0.62%), Tlingit-Haida (2.7%, a difference of 1.0%), and Malaysian (2.7%, a difference of 1.1%).
| Demographics | Rating | Rank | Single Father Households |
| Hawaiians | 0.1 /100 | #284 | Tragic 2.7% |
| Ottawa | 0.1 /100 | #285 | Tragic 2.7% |
| Immigrants | Cuba | 0.1 /100 | #286 | Tragic 2.7% |
| Central American Indians | 0.0 /100 | #287 | Tragic 2.7% |
| Immigrants | Cambodia | 0.0 /100 | #288 | Tragic 2.7% |
| Tlingit-Haida | 0.0 /100 | #289 | Tragic 2.7% |
| Puget Sound Salish | 0.0 /100 | #290 | Tragic 2.7% |
| Blackfeet | 0.0 /100 | #291 | Tragic 2.7% |
| Choctaw | 0.0 /100 | #292 | Tragic 2.7% |
| Immigrants | Fiji | 0.0 /100 | #293 | Tragic 2.7% |
| Malaysians | 0.0 /100 | #294 | Tragic 2.7% |
| Chickasaw | 0.0 /100 | #295 | Tragic 2.8% |
| Japanese | 0.0 /100 | #296 | Tragic 2.8% |
| Hondurans | 0.0 /100 | #297 | Tragic 2.8% |
| Cree | 0.0 /100 | #298 | Tragic 2.8% |
Demographics Similar to Immigrants from Bulgaria by Single Father Households
In terms of single father households, the demographic groups most similar to Immigrants from Bulgaria are Immigrants from Eastern Europe (2.0%, a difference of 0.050%), Immigrants from Sri Lanka (2.0%, a difference of 0.050%), Immigrants from Turkey (2.0%, a difference of 0.18%), Macedonian (2.0%, a difference of 0.33%), and Immigrants from St. Vincent and the Grenadines (2.0%, a difference of 0.35%).
| Demographics | Rating | Rank | Single Father Households |
| Turks | 100.0 /100 | #33 | Exceptional 2.0% |
| Immigrants | Australia | 100.0 /100 | #34 | Exceptional 2.0% |
| Albanians | 100.0 /100 | #35 | Exceptional 2.0% |
| Immigrants | Belgium | 100.0 /100 | #36 | Exceptional 2.0% |
| Immigrants | St. Vincent and the Grenadines | 100.0 /100 | #37 | Exceptional 2.0% |
| Immigrants | Eastern Europe | 100.0 /100 | #38 | Exceptional 2.0% |
| Immigrants | Sri Lanka | 100.0 /100 | #39 | Exceptional 2.0% |
| Immigrants | Bulgaria | 100.0 /100 | #40 | Exceptional 2.0% |
| Immigrants | Turkey | 100.0 /100 | #41 | Exceptional 2.0% |
| Macedonians | 100.0 /100 | #42 | Exceptional 2.0% |
| Immigrants | Grenada | 100.0 /100 | #43 | Exceptional 2.0% |
| Latvians | 100.0 /100 | #44 | Exceptional 2.0% |
| Russians | 100.0 /100 | #45 | Exceptional 2.0% |
| Immigrants | Lebanon | 100.0 /100 | #46 | Exceptional 2.0% |
| Immigrants | Ukraine | 99.9 /100 | #47 | Exceptional 2.0% |