European vs Immigrants from Congo Single Father Households
COMPARE
European
Immigrants from Congo
Single Father Households
Single Father Households Comparison
Europeans
Immigrants from Congo
2.3%
SINGLE FATHER HOUSEHOLDS
80.9/ 100
METRIC RATING
155th/ 347
METRIC RANK
2.5%
SINGLE FATHER HOUSEHOLDS
1.2/ 100
METRIC RATING
257th/ 347
METRIC RANK
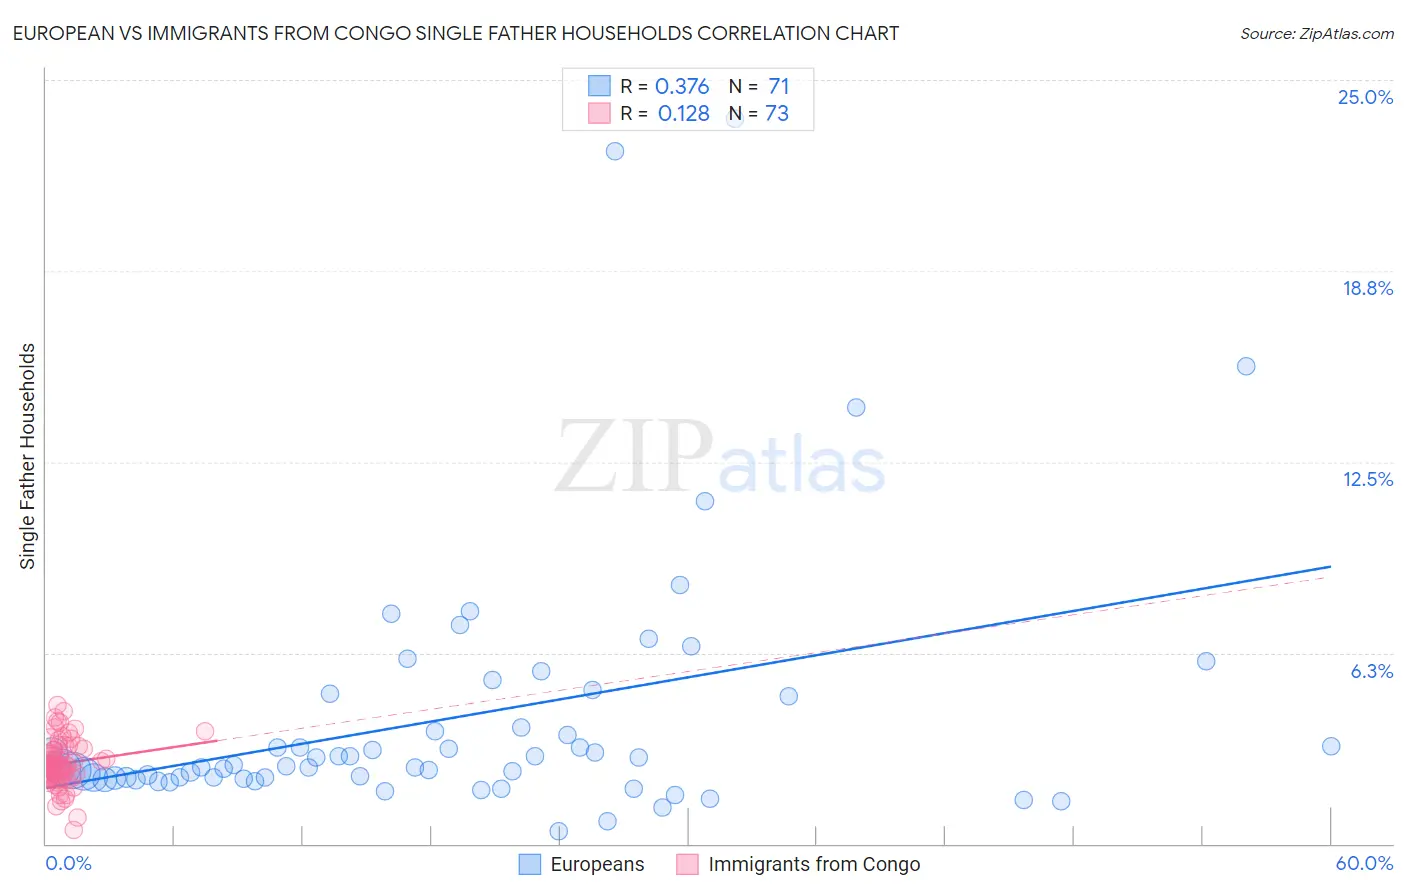
European vs Immigrants from Congo Single Father Households Correlation Chart
The statistical analysis conducted on geographies consisting of 548,404,075 people shows a mild positive correlation between the proportion of Europeans and percentage of single father households in the United States with a correlation coefficient (R) of 0.376 and weighted average of 2.3%. Similarly, the statistical analysis conducted on geographies consisting of 91,926,363 people shows a poor positive correlation between the proportion of Immigrants from Congo and percentage of single father households in the United States with a correlation coefficient (R) of 0.128 and weighted average of 2.5%, a difference of 11.1%.
Single Father Households Correlation Summary
| Measurement | European | Immigrants from Congo |
| Minimum | 0.42% | 0.46% |
| Maximum | 23.7% | 4.5% |
| Range | 23.3% | 4.1% |
| Mean | 4.1% | 2.6% |
| Median | 2.5% | 2.5% |
| Interquartile 25% (IQ1) | 2.1% | 2.2% |
| Interquartile 75% (IQ3) | 4.8% | 3.1% |
| Interquartile Range (IQR) | 2.7% | 0.93% |
| Standard Deviation (Sample) | 4.3% | 0.77% |
| Standard Deviation (Population) | 4.2% | 0.76% |
Similar Demographics by Single Father Households
Demographics Similar to Europeans by Single Father Households
In terms of single father households, the demographic groups most similar to Europeans are Bolivian (2.3%, a difference of 0.020%), Immigrants from South America (2.3%, a difference of 0.12%), Canadian (2.3%, a difference of 0.14%), Immigrants from Senegal (2.3%, a difference of 0.17%), and Immigrants from Germany (2.3%, a difference of 0.24%).
| Demographics | Rating | Rank | Single Father Households |
| South American Indians | 88.5 /100 | #148 | Excellent 2.3% |
| Senegalese | 88.4 /100 | #149 | Excellent 2.3% |
| Venezuelans | 86.2 /100 | #150 | Excellent 2.3% |
| Immigrants | Syria | 84.8 /100 | #151 | Excellent 2.3% |
| Immigrants | Venezuela | 83.2 /100 | #152 | Excellent 2.3% |
| Immigrants | Germany | 82.8 /100 | #153 | Excellent 2.3% |
| Bolivians | 81.0 /100 | #154 | Excellent 2.3% |
| Europeans | 80.9 /100 | #155 | Excellent 2.3% |
| Immigrants | South America | 79.9 /100 | #156 | Good 2.3% |
| Canadians | 79.7 /100 | #157 | Good 2.3% |
| Immigrants | Senegal | 79.4 /100 | #158 | Good 2.3% |
| Immigrants | West Indies | 77.9 /100 | #159 | Good 2.3% |
| Immigrants | Bolivia | 76.3 /100 | #160 | Good 2.3% |
| Swiss | 73.2 /100 | #161 | Good 2.3% |
| Scottish | 72.8 /100 | #162 | Good 2.3% |
Demographics Similar to Immigrants from Congo by Single Father Households
In terms of single father households, the demographic groups most similar to Immigrants from Congo are Spanish (2.5%, a difference of 0.090%), Comanche (2.5%, a difference of 0.24%), Potawatomi (2.5%, a difference of 0.29%), Immigrants from Caribbean (2.5%, a difference of 0.33%), and Tongan (2.5%, a difference of 0.34%).
| Demographics | Rating | Rank | Single Father Households |
| Somalis | 2.1 /100 | #250 | Tragic 2.5% |
| Liberians | 2.0 /100 | #251 | Tragic 2.5% |
| Immigrants | Eritrea | 2.0 /100 | #252 | Tragic 2.5% |
| Immigrants | Somalia | 1.9 /100 | #253 | Tragic 2.5% |
| Immigrants | Thailand | 1.8 /100 | #254 | Tragic 2.5% |
| Tongans | 1.5 /100 | #255 | Tragic 2.5% |
| Potawatomi | 1.4 /100 | #256 | Tragic 2.5% |
| Immigrants | Congo | 1.2 /100 | #257 | Tragic 2.5% |
| Spanish | 1.1 /100 | #258 | Tragic 2.5% |
| Comanche | 1.0 /100 | #259 | Tragic 2.5% |
| Immigrants | Caribbean | 1.0 /100 | #260 | Tragic 2.5% |
| Immigrants | Belize | 0.9 /100 | #261 | Tragic 2.5% |
| Immigrants | Liberia | 0.8 /100 | #262 | Tragic 2.5% |
| Dominicans | 0.8 /100 | #263 | Tragic 2.5% |
| Indonesians | 0.5 /100 | #264 | Tragic 2.6% |