Blackfeet vs Immigrants from Congo 2nd Grade
COMPARE
Blackfeet
Immigrants from Congo
2nd Grade
2nd Grade Comparison
Blackfeet
Immigrants from Congo
98.0%
2ND GRADE
87.5/ 100
METRIC RATING
139th/ 347
METRIC RANK
97.5%
2ND GRADE
0.6/ 100
METRIC RATING
255th/ 347
METRIC RANK
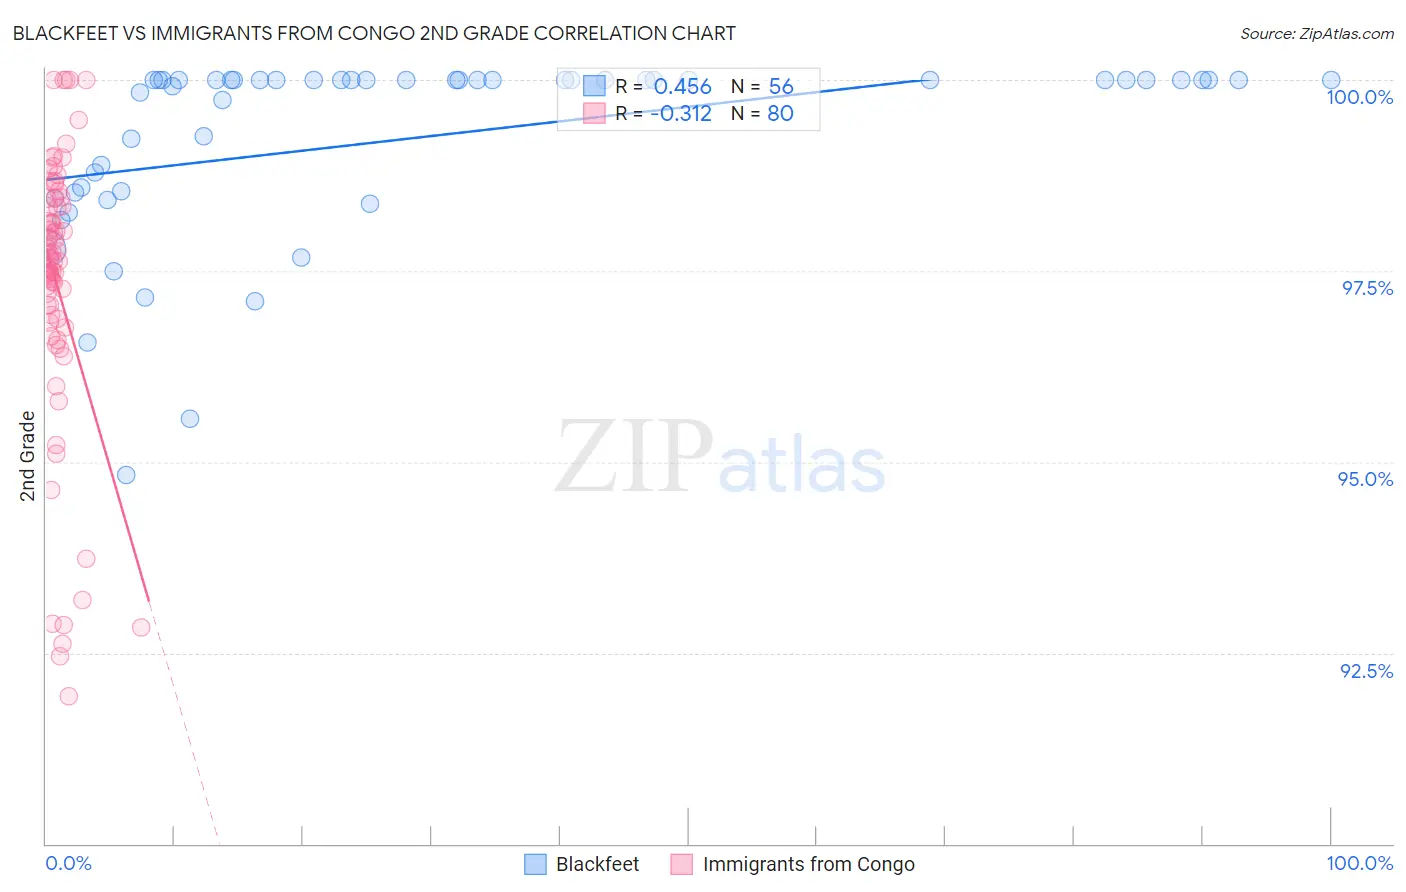
Blackfeet vs Immigrants from Congo 2nd Grade Correlation Chart
The statistical analysis conducted on geographies consisting of 309,580,957 people shows a moderate positive correlation between the proportion of Blackfeet and percentage of population with at least 2nd grade education in the United States with a correlation coefficient (R) of 0.456 and weighted average of 98.0%. Similarly, the statistical analysis conducted on geographies consisting of 92,124,753 people shows a mild negative correlation between the proportion of Immigrants from Congo and percentage of population with at least 2nd grade education in the United States with a correlation coefficient (R) of -0.312 and weighted average of 97.5%, a difference of 0.56%.
2nd Grade Correlation Summary
| Measurement | Blackfeet | Immigrants from Congo |
| Minimum | 94.8% | 91.9% |
| Maximum | 100.0% | 100.0% |
| Range | 5.2% | 8.1% |
| Mean | 99.2% | 97.3% |
| Median | 100.0% | 97.6% |
| Interquartile 25% (IQ1) | 98.5% | 96.8% |
| Interquartile 75% (IQ3) | 100.0% | 98.4% |
| Interquartile Range (IQR) | 1.5% | 1.5% |
| Standard Deviation (Sample) | 1.2% | 1.8% |
| Standard Deviation (Population) | 1.2% | 1.8% |
Similar Demographics by 2nd Grade
Demographics Similar to Blackfeet by 2nd Grade
In terms of 2nd grade, the demographic groups most similar to Blackfeet are Israeli (98.0%, a difference of 0.0%), Immigrants from Kuwait (98.0%, a difference of 0.010%), Immigrants from Romania (98.0%, a difference of 0.010%), Immigrants from Hungary (98.0%, a difference of 0.020%), and Immigrants from Bulgaria (98.0%, a difference of 0.020%).
| Demographics | Rating | Rank | 2nd Grade |
| Spaniards | 90.7 /100 | #132 | Exceptional 98.0% |
| Cambodians | 90.7 /100 | #133 | Exceptional 98.0% |
| Immigrants | Hungary | 89.7 /100 | #134 | Excellent 98.0% |
| Immigrants | Bulgaria | 89.7 /100 | #135 | Excellent 98.0% |
| Immigrants | Kuwait | 89.2 /100 | #136 | Excellent 98.0% |
| Immigrants | Romania | 88.3 /100 | #137 | Excellent 98.0% |
| Israelis | 87.9 /100 | #138 | Excellent 98.0% |
| Blackfeet | 87.5 /100 | #139 | Excellent 98.0% |
| Palestinians | 83.9 /100 | #140 | Excellent 98.0% |
| Immigrants | Turkey | 83.0 /100 | #141 | Excellent 98.0% |
| Burmese | 81.0 /100 | #142 | Excellent 98.0% |
| Alsatians | 80.5 /100 | #143 | Excellent 98.0% |
| Hmong | 80.0 /100 | #144 | Good 98.0% |
| Filipinos | 79.2 /100 | #145 | Good 98.0% |
| Immigrants | Israel | 78.0 /100 | #146 | Good 98.0% |
Demographics Similar to Immigrants from Congo by 2nd Grade
In terms of 2nd grade, the demographic groups most similar to Immigrants from Congo are Indian (Asian) (97.5%, a difference of 0.0%), Jamaican (97.5%, a difference of 0.0%), Puerto Rican (97.5%, a difference of 0.010%), Immigrants from Colombia (97.5%, a difference of 0.010%), and Yaqui (97.5%, a difference of 0.010%).
| Demographics | Rating | Rank | 2nd Grade |
| Immigrants | Middle Africa | 0.9 /100 | #248 | Tragic 97.5% |
| Bolivians | 0.9 /100 | #249 | Tragic 97.5% |
| Peruvians | 0.9 /100 | #250 | Tragic 97.5% |
| Immigrants | Africa | 0.8 /100 | #251 | Tragic 97.5% |
| Immigrants | Asia | 0.7 /100 | #252 | Tragic 97.5% |
| Puerto Ricans | 0.7 /100 | #253 | Tragic 97.5% |
| Indians (Asian) | 0.6 /100 | #254 | Tragic 97.5% |
| Immigrants | Congo | 0.6 /100 | #255 | Tragic 97.5% |
| Jamaicans | 0.6 /100 | #256 | Tragic 97.5% |
| Immigrants | Colombia | 0.5 /100 | #257 | Tragic 97.5% |
| Yaqui | 0.5 /100 | #258 | Tragic 97.5% |
| Fijians | 0.5 /100 | #259 | Tragic 97.5% |
| Assyrians/Chaldeans/Syriacs | 0.5 /100 | #260 | Tragic 97.5% |
| Armenians | 0.5 /100 | #261 | Tragic 97.5% |
| Taiwanese | 0.4 /100 | #262 | Tragic 97.4% |