Mexican vs English Divorced or Separated
COMPARE
Mexican
English
Divorced or Separated
Divorced or Separated Comparison
Mexicans
English
12.2%
DIVORCED OR SEPARATED
21.0/ 100
METRIC RATING
207th/ 347
METRIC RANK
12.6%
DIVORCED OR SEPARATED
0.5/ 100
METRIC RATING
264th/ 347
METRIC RANK
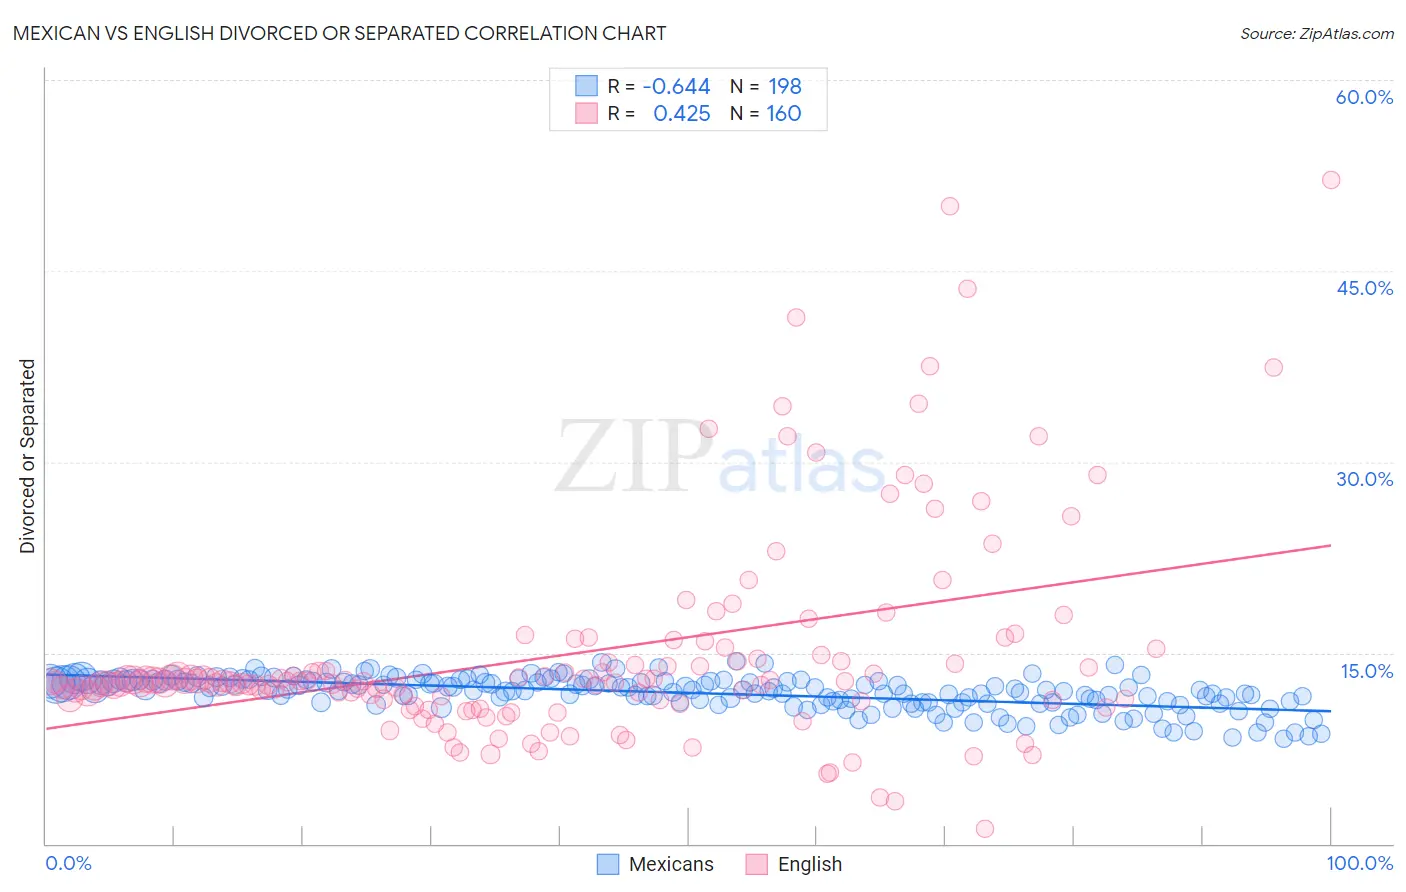
Mexican vs English Divorced or Separated Correlation Chart
The statistical analysis conducted on geographies consisting of 564,740,181 people shows a significant negative correlation between the proportion of Mexicans and percentage of population currently divorced or separated in the United States with a correlation coefficient (R) of -0.644 and weighted average of 12.2%. Similarly, the statistical analysis conducted on geographies consisting of 579,335,226 people shows a moderate positive correlation between the proportion of English and percentage of population currently divorced or separated in the United States with a correlation coefficient (R) of 0.425 and weighted average of 12.6%, a difference of 3.5%.
Divorced or Separated Correlation Summary
| Measurement | Mexican | English |
| Minimum | 8.3% | 1.2% |
| Maximum | 14.3% | 52.1% |
| Range | 6.1% | 50.9% |
| Mean | 11.9% | 14.9% |
| Median | 12.1% | 12.8% |
| Interquartile 25% (IQ1) | 11.1% | 11.3% |
| Interquartile 75% (IQ3) | 12.8% | 14.4% |
| Interquartile Range (IQR) | 1.6% | 3.1% |
| Standard Deviation (Sample) | 1.3% | 8.2% |
| Standard Deviation (Population) | 1.3% | 8.2% |
Similar Demographics by Divorced or Separated
Demographics Similar to Mexicans by Divorced or Separated
In terms of divorced or separated, the demographic groups most similar to Mexicans are Slovak (12.2%, a difference of 0.0%), Immigrants from Costa Rica (12.2%, a difference of 0.010%), Kenyan (12.2%, a difference of 0.040%), Immigrants from Guatemala (12.2%, a difference of 0.11%), and Immigrants from Ghana (12.2%, a difference of 0.12%).
| Demographics | Rating | Rank | Divorced or Separated |
| South Americans | 28.6 /100 | #200 | Fair 12.2% |
| Guatemalans | 26.9 /100 | #201 | Fair 12.2% |
| Portuguese | 23.5 /100 | #202 | Fair 12.2% |
| Immigrants | Guatemala | 23.2 /100 | #203 | Fair 12.2% |
| Kenyans | 21.8 /100 | #204 | Fair 12.2% |
| Immigrants | Costa Rica | 21.3 /100 | #205 | Fair 12.2% |
| Slovaks | 21.0 /100 | #206 | Fair 12.2% |
| Mexicans | 21.0 /100 | #207 | Fair 12.2% |
| Immigrants | Ghana | 18.8 /100 | #208 | Poor 12.2% |
| Immigrants | Trinidad and Tobago | 17.8 /100 | #209 | Poor 12.2% |
| Slavs | 17.0 /100 | #210 | Poor 12.2% |
| Trinidadians and Tobagonians | 16.6 /100 | #211 | Poor 12.2% |
| Immigrants | Kenya | 16.5 /100 | #212 | Poor 12.2% |
| Immigrants | Eastern Africa | 16.2 /100 | #213 | Poor 12.2% |
| Immigrants | Argentina | 15.5 /100 | #214 | Poor 12.2% |
Demographics Similar to English by Divorced or Separated
In terms of divorced or separated, the demographic groups most similar to English are Immigrants from Panama (12.6%, a difference of 0.020%), Immigrants from Senegal (12.6%, a difference of 0.020%), White/Caucasian (12.6%, a difference of 0.030%), Basque (12.6%, a difference of 0.070%), and Scottish (12.6%, a difference of 0.070%).
| Demographics | Rating | Rank | Divorced or Separated |
| Immigrants | Somalia | 0.6 /100 | #257 | Tragic 12.6% |
| Indonesians | 0.6 /100 | #258 | Tragic 12.6% |
| Yuman | 0.6 /100 | #259 | Tragic 12.6% |
| Immigrants | Uruguay | 0.6 /100 | #260 | Tragic 12.6% |
| Immigrants | Dominica | 0.5 /100 | #261 | Tragic 12.6% |
| Basques | 0.5 /100 | #262 | Tragic 12.6% |
| Immigrants | Panama | 0.5 /100 | #263 | Tragic 12.6% |
| English | 0.5 /100 | #264 | Tragic 12.6% |
| Immigrants | Senegal | 0.5 /100 | #265 | Tragic 12.6% |
| Whites/Caucasians | 0.5 /100 | #266 | Tragic 12.6% |
| Scottish | 0.4 /100 | #267 | Tragic 12.6% |
| Fijians | 0.4 /100 | #268 | Tragic 12.6% |
| Immigrants | Liberia | 0.4 /100 | #269 | Tragic 12.6% |
| Ute | 0.4 /100 | #270 | Tragic 12.6% |
| Panamanians | 0.3 /100 | #271 | Tragic 12.7% |