Bhutanese vs English Hearing Disability
COMPARE
Bhutanese
English
Hearing Disability
Hearing Disability Comparison
Bhutanese
English
3.2%
HEARING DISABILITY
4.6/ 100
METRIC RATING
227th/ 347
METRIC RANK
3.8%
HEARING DISABILITY
0.0/ 100
METRIC RATING
305th/ 347
METRIC RANK
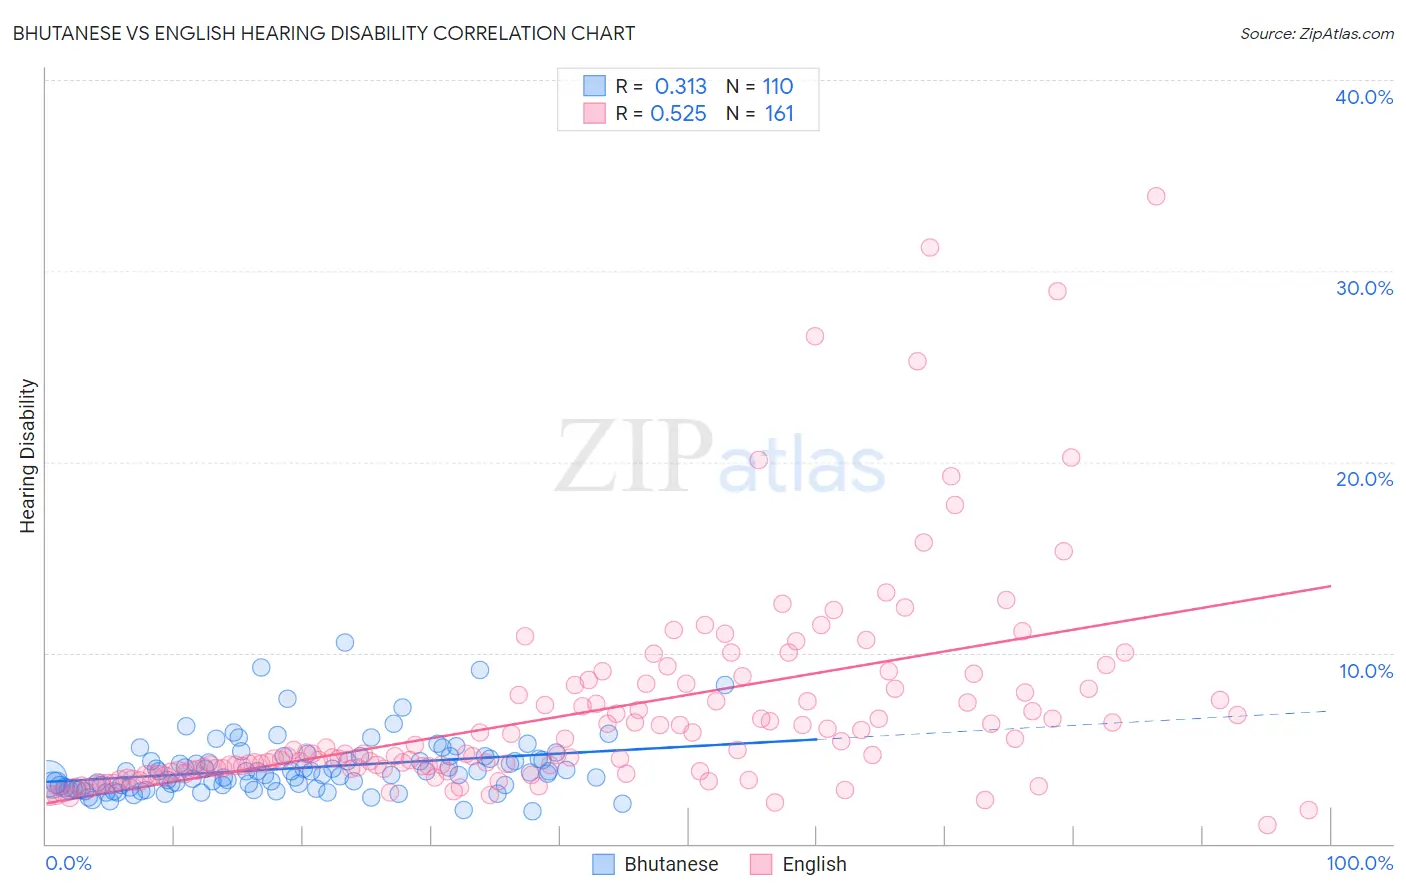
Bhutanese vs English Hearing Disability Correlation Chart
The statistical analysis conducted on geographies consisting of 455,292,805 people shows a mild positive correlation between the proportion of Bhutanese and percentage of population with hearing disability in the United States with a correlation coefficient (R) of 0.313 and weighted average of 3.2%. Similarly, the statistical analysis conducted on geographies consisting of 578,898,364 people shows a substantial positive correlation between the proportion of English and percentage of population with hearing disability in the United States with a correlation coefficient (R) of 0.525 and weighted average of 3.8%, a difference of 17.7%.
Hearing Disability Correlation Summary
| Measurement | Bhutanese | English |
| Minimum | 1.7% | 1.0% |
| Maximum | 10.5% | 33.9% |
| Range | 8.8% | 32.9% |
| Mean | 4.0% | 6.8% |
| Median | 3.7% | 4.7% |
| Interquartile 25% (IQ1) | 3.0% | 3.8% |
| Interquartile 75% (IQ3) | 4.4% | 8.0% |
| Interquartile Range (IQR) | 1.5% | 4.2% |
| Standard Deviation (Sample) | 1.5% | 5.4% |
| Standard Deviation (Population) | 1.5% | 5.4% |
Similar Demographics by Hearing Disability
Demographics Similar to Bhutanese by Hearing Disability
In terms of hearing disability, the demographic groups most similar to Bhutanese are Lebanese (3.2%, a difference of 0.18%), Immigrants from Portugal (3.2%, a difference of 0.20%), Latvian (3.2%, a difference of 0.23%), Icelander (3.2%, a difference of 0.27%), and Maltese (3.2%, a difference of 0.30%).
| Demographics | Rating | Rank | Hearing Disability |
| Malaysians | 6.6 /100 | #220 | Tragic 3.2% |
| Immigrants | Laos | 6.6 /100 | #221 | Tragic 3.2% |
| Immigrants | Oceania | 6.5 /100 | #222 | Tragic 3.2% |
| Mexicans | 5.6 /100 | #223 | Tragic 3.2% |
| Icelanders | 5.2 /100 | #224 | Tragic 3.2% |
| Latvians | 5.1 /100 | #225 | Tragic 3.2% |
| Lebanese | 5.0 /100 | #226 | Tragic 3.2% |
| Bhutanese | 4.6 /100 | #227 | Tragic 3.2% |
| Immigrants | Portugal | 4.3 /100 | #228 | Tragic 3.2% |
| Maltese | 4.1 /100 | #229 | Tragic 3.2% |
| Greeks | 3.2 /100 | #230 | Tragic 3.2% |
| Luxembourgers | 2.9 /100 | #231 | Tragic 3.2% |
| Ukrainians | 2.9 /100 | #232 | Tragic 3.2% |
| Estonians | 2.4 /100 | #233 | Tragic 3.3% |
| Central American Indians | 2.3 /100 | #234 | Tragic 3.3% |
Demographics Similar to English by Hearing Disability
In terms of hearing disability, the demographic groups most similar to English are French (3.8%, a difference of 0.57%), Marshallese (3.8%, a difference of 0.86%), Menominee (3.7%, a difference of 0.87%), Dutch (3.7%, a difference of 0.93%), and French Canadian (3.8%, a difference of 0.98%).
| Demographics | Rating | Rank | Hearing Disability |
| Celtics | 0.0 /100 | #298 | Tragic 3.7% |
| Germans | 0.0 /100 | #299 | Tragic 3.7% |
| Scottish | 0.0 /100 | #300 | Tragic 3.7% |
| Pennsylvania Germans | 0.0 /100 | #301 | Tragic 3.7% |
| Dutch | 0.0 /100 | #302 | Tragic 3.7% |
| Menominee | 0.0 /100 | #303 | Tragic 3.7% |
| French | 0.0 /100 | #304 | Tragic 3.8% |
| English | 0.0 /100 | #305 | Tragic 3.8% |
| Marshallese | 0.0 /100 | #306 | Tragic 3.8% |
| French Canadians | 0.0 /100 | #307 | Tragic 3.8% |
| Ottawa | 0.0 /100 | #308 | Tragic 3.8% |
| Scotch-Irish | 0.0 /100 | #309 | Tragic 3.8% |
| Cree | 0.0 /100 | #310 | Tragic 3.8% |
| Americans | 0.0 /100 | #311 | Tragic 3.9% |
| Cajuns | 0.0 /100 | #312 | Tragic 3.9% |