Colville vs English Divorced or Separated
COMPARE
Colville
English
Divorced or Separated
Divorced or Separated Comparison
Colville
English
14.2%
DIVORCED OR SEPARATED
0.0/ 100
METRIC RATING
339th/ 347
METRIC RANK
12.6%
DIVORCED OR SEPARATED
0.5/ 100
METRIC RATING
264th/ 347
METRIC RANK
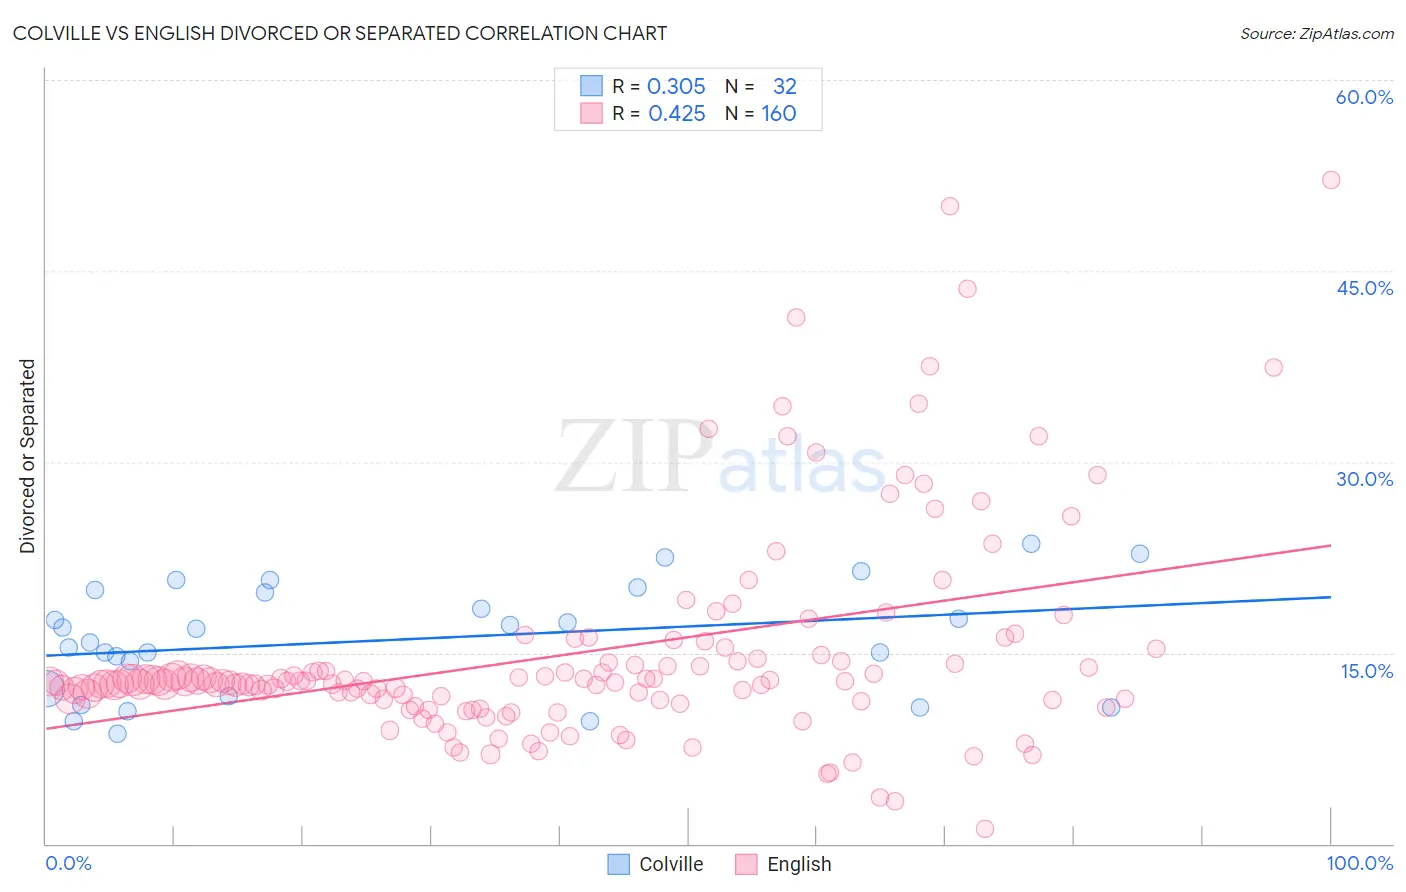
Colville vs English Divorced or Separated Correlation Chart
The statistical analysis conducted on geographies consisting of 34,683,925 people shows a mild positive correlation between the proportion of Colville and percentage of population currently divorced or separated in the United States with a correlation coefficient (R) of 0.305 and weighted average of 14.2%. Similarly, the statistical analysis conducted on geographies consisting of 579,335,226 people shows a moderate positive correlation between the proportion of English and percentage of population currently divorced or separated in the United States with a correlation coefficient (R) of 0.425 and weighted average of 12.6%, a difference of 12.6%.
Divorced or Separated Correlation Summary
| Measurement | Colville | English |
| Minimum | 8.6% | 1.2% |
| Maximum | 23.6% | 52.1% |
| Range | 15.0% | 50.9% |
| Mean | 16.0% | 14.9% |
| Median | 16.4% | 12.8% |
| Interquartile 25% (IQ1) | 11.9% | 11.3% |
| Interquartile 75% (IQ3) | 19.8% | 14.4% |
| Interquartile Range (IQR) | 8.0% | 3.1% |
| Standard Deviation (Sample) | 4.3% | 8.2% |
| Standard Deviation (Population) | 4.2% | 8.2% |
Similar Demographics by Divorced or Separated
Demographics Similar to Colville by Divorced or Separated
In terms of divorced or separated, the demographic groups most similar to Colville are Chickasaw (14.2%, a difference of 0.040%), Bahamian (14.2%, a difference of 0.24%), Seminole (14.3%, a difference of 0.40%), Choctaw (14.1%, a difference of 0.53%), and Crow (14.1%, a difference of 0.84%).
| Demographics | Rating | Rank | Divorced or Separated |
| Cherokee | 0.0 /100 | #332 | Tragic 13.7% |
| Puerto Ricans | 0.0 /100 | #333 | Tragic 13.9% |
| Immigrants | Bahamas | 0.0 /100 | #334 | Tragic 13.9% |
| Dutch West Indians | 0.0 /100 | #335 | Tragic 14.0% |
| Shoshone | 0.0 /100 | #336 | Tragic 14.0% |
| Crow | 0.0 /100 | #337 | Tragic 14.1% |
| Choctaw | 0.0 /100 | #338 | Tragic 14.1% |
| Colville | 0.0 /100 | #339 | Tragic 14.2% |
| Chickasaw | 0.0 /100 | #340 | Tragic 14.2% |
| Bahamians | 0.0 /100 | #341 | Tragic 14.2% |
| Seminole | 0.0 /100 | #342 | Tragic 14.3% |
| Creek | 0.0 /100 | #343 | Tragic 14.4% |
| Cubans | 0.0 /100 | #344 | Tragic 14.5% |
| Kiowa | 0.0 /100 | #345 | Tragic 14.5% |
| Arapaho | 0.0 /100 | #346 | Tragic 14.8% |
Demographics Similar to English by Divorced or Separated
In terms of divorced or separated, the demographic groups most similar to English are Immigrants from Panama (12.6%, a difference of 0.020%), Immigrants from Senegal (12.6%, a difference of 0.020%), White/Caucasian (12.6%, a difference of 0.030%), Basque (12.6%, a difference of 0.070%), and Scottish (12.6%, a difference of 0.070%).
| Demographics | Rating | Rank | Divorced or Separated |
| Immigrants | Somalia | 0.6 /100 | #257 | Tragic 12.6% |
| Indonesians | 0.6 /100 | #258 | Tragic 12.6% |
| Yuman | 0.6 /100 | #259 | Tragic 12.6% |
| Immigrants | Uruguay | 0.6 /100 | #260 | Tragic 12.6% |
| Immigrants | Dominica | 0.5 /100 | #261 | Tragic 12.6% |
| Basques | 0.5 /100 | #262 | Tragic 12.6% |
| Immigrants | Panama | 0.5 /100 | #263 | Tragic 12.6% |
| English | 0.5 /100 | #264 | Tragic 12.6% |
| Immigrants | Senegal | 0.5 /100 | #265 | Tragic 12.6% |
| Whites/Caucasians | 0.5 /100 | #266 | Tragic 12.6% |
| Scottish | 0.4 /100 | #267 | Tragic 12.6% |
| Fijians | 0.4 /100 | #268 | Tragic 12.6% |
| Immigrants | Liberia | 0.4 /100 | #269 | Tragic 12.6% |
| Ute | 0.4 /100 | #270 | Tragic 12.6% |
| Panamanians | 0.3 /100 | #271 | Tragic 12.7% |