Bhutanese vs English Unemployment Among Women with Children Ages 6 to 17 years
COMPARE
Bhutanese
English
Unemployment Among Women with Children Ages 6 to 17 years
Unemployment Among Women with Children Ages 6 to 17 years Comparison
Bhutanese
English
8.1%
UNEMPLOYMENT AMONG WOMEN WITH CHILDREN AGES 6 TO 17 YEARS
100.0/ 100
METRIC RATING
43rd/ 347
METRIC RANK
9.4%
UNEMPLOYMENT AMONG WOMEN WITH CHILDREN AGES 6 TO 17 YEARS
1.9/ 100
METRIC RATING
244th/ 347
METRIC RANK
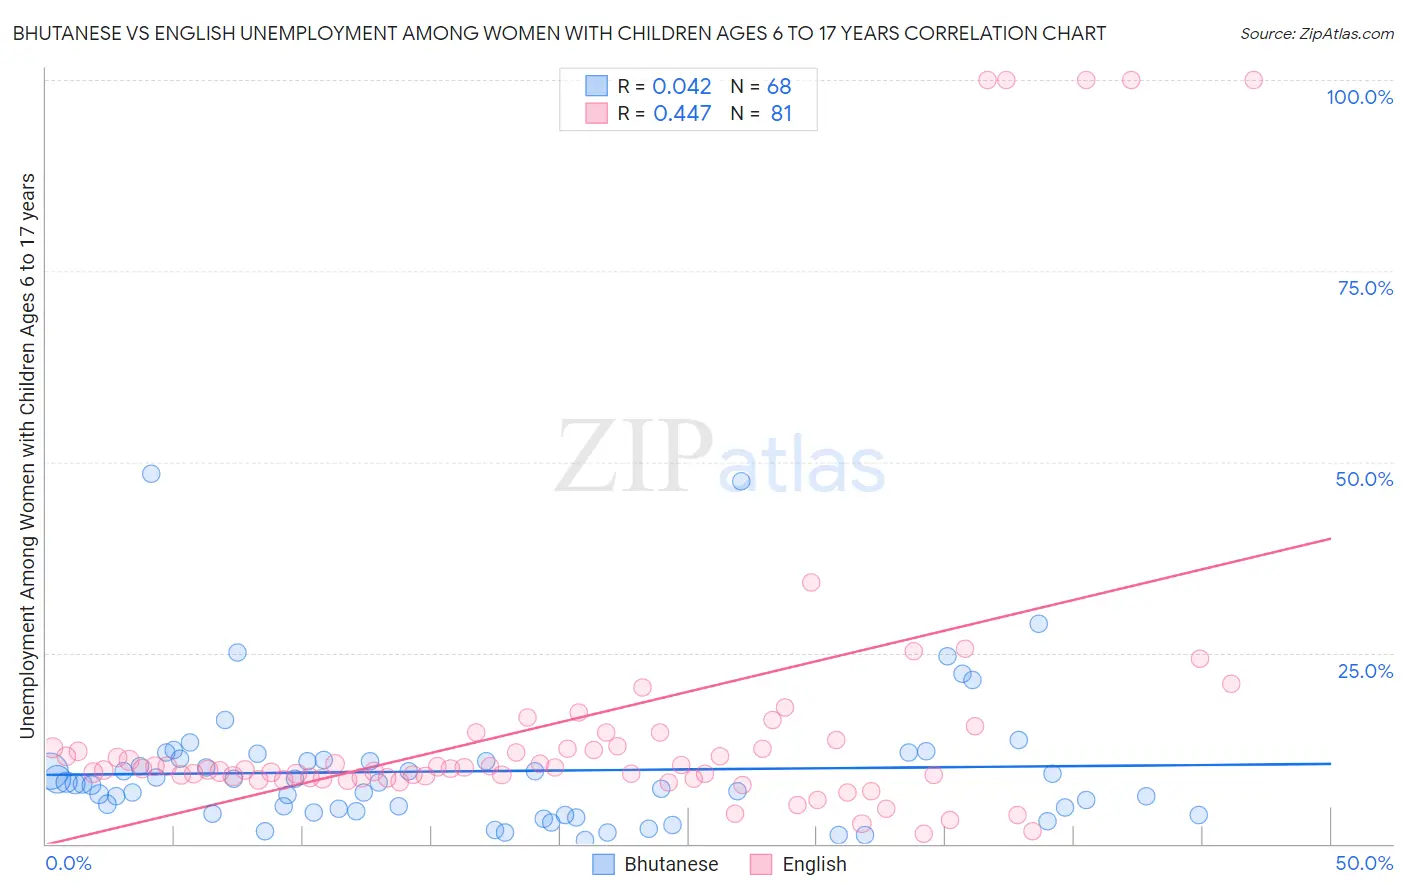
Bhutanese vs English Unemployment Among Women with Children Ages 6 to 17 years Correlation Chart
The statistical analysis conducted on geographies consisting of 316,750,303 people shows no correlation between the proportion of Bhutanese and unemployment rate among women with children between the ages 6 and 17 in the United States with a correlation coefficient (R) of 0.042 and weighted average of 8.1%. Similarly, the statistical analysis conducted on geographies consisting of 358,817,794 people shows a moderate positive correlation between the proportion of English and unemployment rate among women with children between the ages 6 and 17 in the United States with a correlation coefficient (R) of 0.447 and weighted average of 9.4%, a difference of 16.1%.
Unemployment Among Women with Children Ages 6 to 17 years Correlation Summary
| Measurement | Bhutanese | English |
| Minimum | 0.50% | 1.3% |
| Maximum | 48.4% | 100.0% |
| Range | 47.9% | 98.7% |
| Mean | 9.5% | 16.4% |
| Median | 7.8% | 9.8% |
| Interquartile 25% (IQ1) | 4.1% | 8.6% |
| Interquartile 75% (IQ3) | 10.9% | 13.2% |
| Interquartile Range (IQR) | 6.8% | 4.6% |
| Standard Deviation (Sample) | 8.9% | 22.2% |
| Standard Deviation (Population) | 8.8% | 22.1% |
Similar Demographics by Unemployment Among Women with Children Ages 6 to 17 years
Demographics Similar to Bhutanese by Unemployment Among Women with Children Ages 6 to 17 years
In terms of unemployment among women with children ages 6 to 17 years, the demographic groups most similar to Bhutanese are Immigrants from Sweden (8.1%, a difference of 0.040%), Immigrants from Bulgaria (8.1%, a difference of 0.080%), Icelander (8.1%, a difference of 0.10%), Immigrants from Somalia (8.0%, a difference of 0.14%), and Immigrants from Switzerland (8.1%, a difference of 0.14%).
| Demographics | Rating | Rank | Unemployment Among Women with Children Ages 6 to 17 years |
| Burmese | 100.0 /100 | #36 | Exceptional 8.0% |
| Asians | 100.0 /100 | #37 | Exceptional 8.0% |
| Alsatians | 100.0 /100 | #38 | Exceptional 8.0% |
| Somalis | 100.0 /100 | #39 | Exceptional 8.0% |
| Immigrants | Zimbabwe | 100.0 /100 | #40 | Exceptional 8.0% |
| Iranians | 100.0 /100 | #41 | Exceptional 8.0% |
| Immigrants | Somalia | 100.0 /100 | #42 | Exceptional 8.0% |
| Bhutanese | 100.0 /100 | #43 | Exceptional 8.1% |
| Immigrants | Sweden | 100.0 /100 | #44 | Exceptional 8.1% |
| Immigrants | Bulgaria | 100.0 /100 | #45 | Exceptional 8.1% |
| Icelanders | 100.0 /100 | #46 | Exceptional 8.1% |
| Immigrants | Switzerland | 100.0 /100 | #47 | Exceptional 8.1% |
| Immigrants | Asia | 100.0 /100 | #48 | Exceptional 8.1% |
| Immigrants | Oceania | 100.0 /100 | #49 | Exceptional 8.1% |
| Hawaiians | 100.0 /100 | #50 | Exceptional 8.1% |
Demographics Similar to English by Unemployment Among Women with Children Ages 6 to 17 years
In terms of unemployment among women with children ages 6 to 17 years, the demographic groups most similar to English are Immigrants from Cameroon (9.4%, a difference of 0.030%), Scottish (9.4%, a difference of 0.050%), Immigrants from Colombia (9.3%, a difference of 0.14%), Colombian (9.3%, a difference of 0.16%), and Immigrants from Africa (9.4%, a difference of 0.20%).
| Demographics | Rating | Rank | Unemployment Among Women with Children Ages 6 to 17 years |
| Immigrants | Belize | 2.8 /100 | #237 | Tragic 9.3% |
| Arabs | 2.7 /100 | #238 | Tragic 9.3% |
| Immigrants | Saudi Arabia | 2.7 /100 | #239 | Tragic 9.3% |
| Guatemalans | 2.3 /100 | #240 | Tragic 9.3% |
| Colombians | 2.2 /100 | #241 | Tragic 9.3% |
| Immigrants | Colombia | 2.1 /100 | #242 | Tragic 9.3% |
| Scottish | 2.0 /100 | #243 | Tragic 9.4% |
| English | 1.9 /100 | #244 | Tragic 9.4% |
| Immigrants | Cameroon | 1.8 /100 | #245 | Tragic 9.4% |
| Immigrants | Africa | 1.6 /100 | #246 | Tragic 9.4% |
| Poles | 1.5 /100 | #247 | Tragic 9.4% |
| Dutch | 1.5 /100 | #248 | Tragic 9.4% |
| Immigrants | South America | 1.5 /100 | #249 | Tragic 9.4% |
| Immigrants | Guatemala | 1.3 /100 | #250 | Tragic 9.4% |
| Central Americans | 1.3 /100 | #251 | Tragic 9.4% |