Belizean vs Immigrants from Sudan Single Father Households
COMPARE
Belizean
Immigrants from Sudan
Single Father Households
Single Father Households Comparison
Belizeans
Immigrants from Sudan
2.6%
SINGLE FATHER HOUSEHOLDS
0.2/ 100
METRIC RATING
272nd/ 347
METRIC RANK
2.4%
SINGLE FATHER HOUSEHOLDS
29.8/ 100
METRIC RATING
192nd/ 347
METRIC RANK
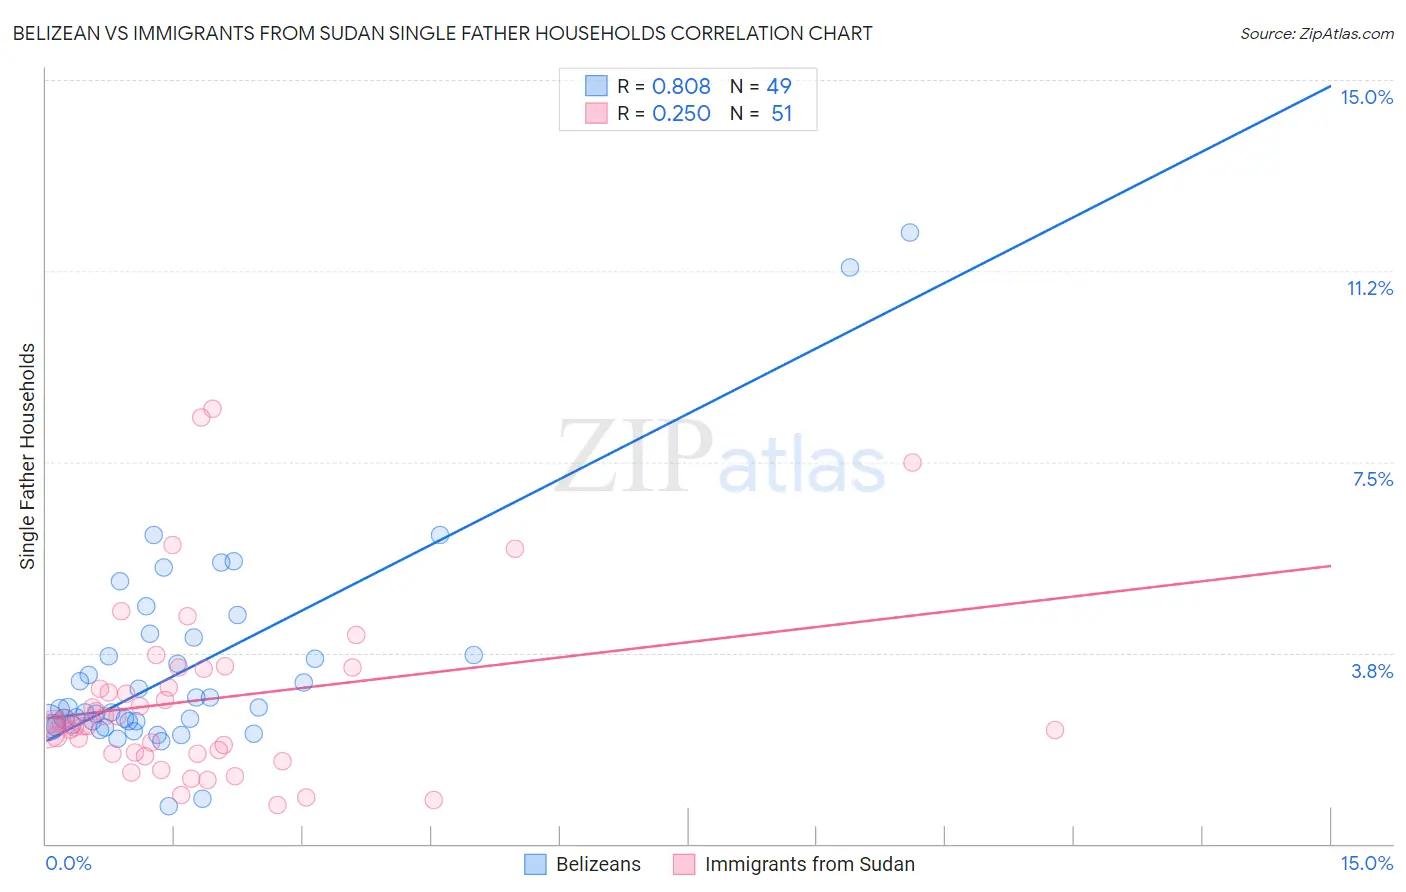
Belizean vs Immigrants from Sudan Single Father Households Correlation Chart
The statistical analysis conducted on geographies consisting of 143,901,350 people shows a very strong positive correlation between the proportion of Belizeans and percentage of single father households in the United States with a correlation coefficient (R) of 0.808 and weighted average of 2.6%. Similarly, the statistical analysis conducted on geographies consisting of 118,770,797 people shows a weak positive correlation between the proportion of Immigrants from Sudan and percentage of single father households in the United States with a correlation coefficient (R) of 0.250 and weighted average of 2.4%, a difference of 9.6%.
Single Father Households Correlation Summary
| Measurement | Belizean | Immigrants from Sudan |
| Minimum | 0.75% | 0.77% |
| Maximum | 12.0% | 8.6% |
| Range | 11.3% | 7.8% |
| Mean | 3.4% | 2.8% |
| Median | 2.6% | 2.4% |
| Interquartile 25% (IQ1) | 2.3% | 1.8% |
| Interquartile 75% (IQ3) | 3.9% | 3.4% |
| Interquartile Range (IQR) | 1.6% | 1.7% |
| Standard Deviation (Sample) | 2.1% | 1.7% |
| Standard Deviation (Population) | 2.1% | 1.7% |
Similar Demographics by Single Father Households
Demographics Similar to Belizeans by Single Father Households
In terms of single father households, the demographic groups most similar to Belizeans are Creek (2.6%, a difference of 0.0%), Iroquois (2.6%, a difference of 0.040%), Puerto Rican (2.6%, a difference of 0.070%), Seminole (2.6%, a difference of 0.37%), and Immigrants from Dominican Republic (2.6%, a difference of 0.49%).
| Demographics | Rating | Rank | Single Father Households |
| Immigrants | Micronesia | 0.5 /100 | #265 | Tragic 2.6% |
| French American Indians | 0.5 /100 | #266 | Tragic 2.6% |
| Guamanians/Chamorros | 0.4 /100 | #267 | Tragic 2.6% |
| Haitians | 0.4 /100 | #268 | Tragic 2.6% |
| Cubans | 0.3 /100 | #269 | Tragic 2.6% |
| Seminole | 0.3 /100 | #270 | Tragic 2.6% |
| Creek | 0.2 /100 | #271 | Tragic 2.6% |
| Belizeans | 0.2 /100 | #272 | Tragic 2.6% |
| Iroquois | 0.2 /100 | #273 | Tragic 2.6% |
| Puerto Ricans | 0.2 /100 | #274 | Tragic 2.6% |
| Immigrants | Dominican Republic | 0.2 /100 | #275 | Tragic 2.6% |
| Immigrants | Haiti | 0.1 /100 | #276 | Tragic 2.6% |
| Shoshone | 0.1 /100 | #277 | Tragic 2.6% |
| Cherokee | 0.1 /100 | #278 | Tragic 2.6% |
| Samoans | 0.1 /100 | #279 | Tragic 2.6% |
Demographics Similar to Immigrants from Sudan by Single Father Households
In terms of single father households, the demographic groups most similar to Immigrants from Sudan are Immigrants from Africa (2.4%, a difference of 0.010%), Uruguayan (2.4%, a difference of 0.010%), Panamanian (2.4%, a difference of 0.020%), Immigrants from Philippines (2.4%, a difference of 0.10%), and Kenyan (2.4%, a difference of 0.15%).
| Demographics | Rating | Rank | Single Father Households |
| Nigerians | 41.0 /100 | #185 | Average 2.4% |
| Immigrants | Bosnia and Herzegovina | 40.4 /100 | #186 | Average 2.4% |
| Immigrants | Colombia | 34.0 /100 | #187 | Fair 2.4% |
| Hmong | 33.0 /100 | #188 | Fair 2.4% |
| U.S. Virgin Islanders | 31.8 /100 | #189 | Fair 2.4% |
| French | 31.7 /100 | #190 | Fair 2.4% |
| Immigrants | Africa | 30.0 /100 | #191 | Fair 2.4% |
| Immigrants | Sudan | 29.8 /100 | #192 | Fair 2.4% |
| Uruguayans | 29.7 /100 | #193 | Fair 2.4% |
| Panamanians | 29.6 /100 | #194 | Fair 2.4% |
| Immigrants | Philippines | 28.7 /100 | #195 | Fair 2.4% |
| Kenyans | 28.0 /100 | #196 | Fair 2.4% |
| Germans | 28.0 /100 | #197 | Fair 2.4% |
| Scandinavians | 27.4 /100 | #198 | Fair 2.4% |
| Immigrants | Vietnam | 27.1 /100 | #199 | Fair 2.4% |