Belizean vs Albanian Single Father Households
COMPARE
Belizean
Albanian
Single Father Households
Single Father Households Comparison
Belizeans
Albanians
2.6%
SINGLE FATHER HOUSEHOLDS
0.2/ 100
METRIC RATING
272nd/ 347
METRIC RANK
2.0%
SINGLE FATHER HOUSEHOLDS
100.0/ 100
METRIC RATING
35th/ 347
METRIC RANK
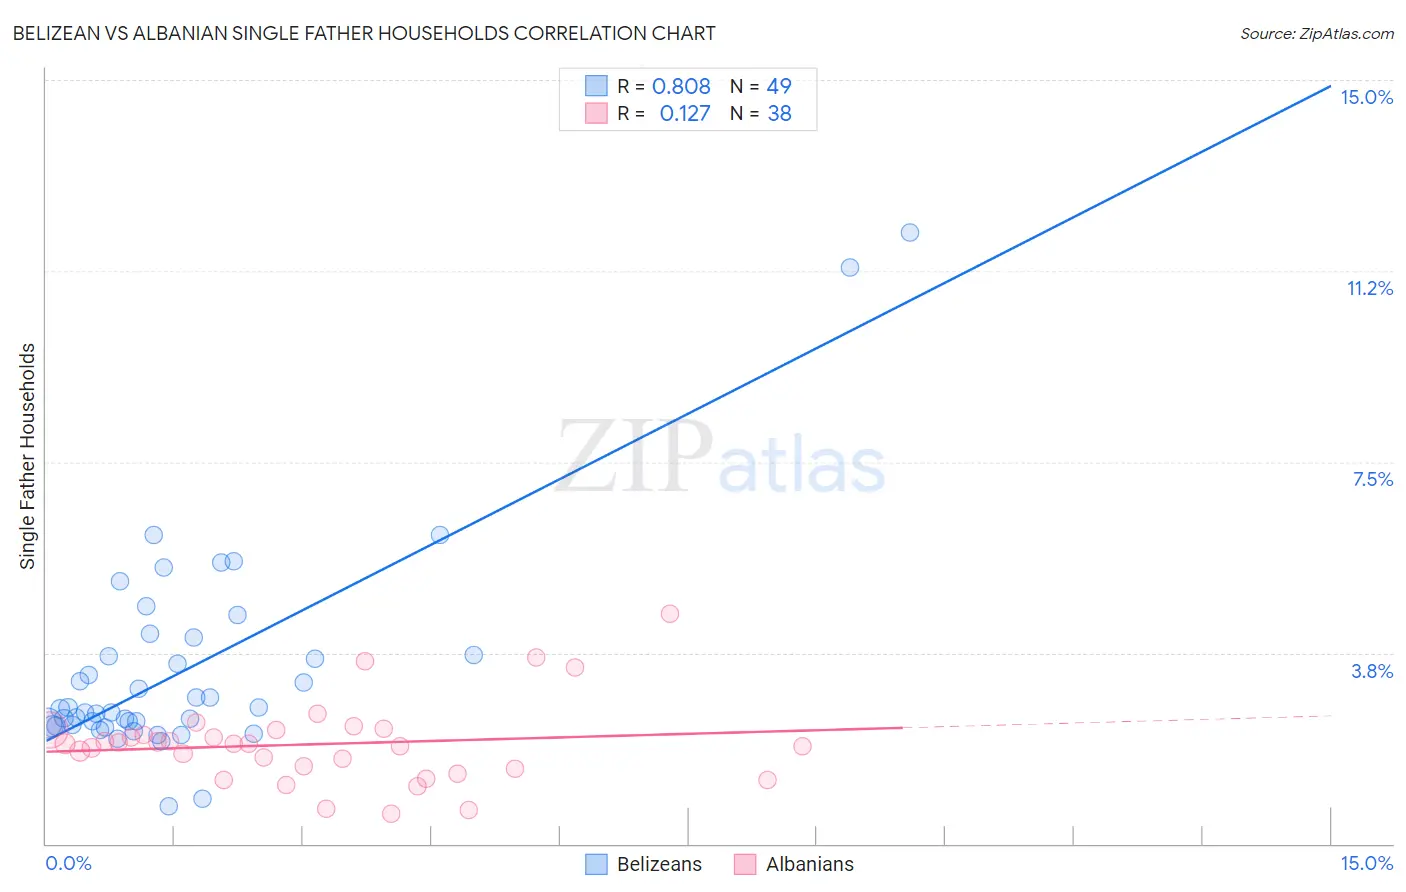
Belizean vs Albanian Single Father Households Correlation Chart
The statistical analysis conducted on geographies consisting of 143,901,350 people shows a very strong positive correlation between the proportion of Belizeans and percentage of single father households in the United States with a correlation coefficient (R) of 0.808 and weighted average of 2.6%. Similarly, the statistical analysis conducted on geographies consisting of 192,201,260 people shows a poor positive correlation between the proportion of Albanians and percentage of single father households in the United States with a correlation coefficient (R) of 0.127 and weighted average of 2.0%, a difference of 31.2%.
Single Father Households Correlation Summary
| Measurement | Belizean | Albanian |
| Minimum | 0.75% | 0.59% |
| Maximum | 12.0% | 4.5% |
| Range | 11.3% | 3.9% |
| Mean | 3.4% | 2.0% |
| Median | 2.6% | 2.0% |
| Interquartile 25% (IQ1) | 2.3% | 1.5% |
| Interquartile 75% (IQ3) | 3.9% | 2.2% |
| Interquartile Range (IQR) | 1.6% | 0.77% |
| Standard Deviation (Sample) | 2.1% | 0.81% |
| Standard Deviation (Population) | 2.1% | 0.80% |
Similar Demographics by Single Father Households
Demographics Similar to Belizeans by Single Father Households
In terms of single father households, the demographic groups most similar to Belizeans are Creek (2.6%, a difference of 0.0%), Iroquois (2.6%, a difference of 0.040%), Puerto Rican (2.6%, a difference of 0.070%), Seminole (2.6%, a difference of 0.37%), and Immigrants from Dominican Republic (2.6%, a difference of 0.49%).
| Demographics | Rating | Rank | Single Father Households |
| Immigrants | Micronesia | 0.5 /100 | #265 | Tragic 2.6% |
| French American Indians | 0.5 /100 | #266 | Tragic 2.6% |
| Guamanians/Chamorros | 0.4 /100 | #267 | Tragic 2.6% |
| Haitians | 0.4 /100 | #268 | Tragic 2.6% |
| Cubans | 0.3 /100 | #269 | Tragic 2.6% |
| Seminole | 0.3 /100 | #270 | Tragic 2.6% |
| Creek | 0.2 /100 | #271 | Tragic 2.6% |
| Belizeans | 0.2 /100 | #272 | Tragic 2.6% |
| Iroquois | 0.2 /100 | #273 | Tragic 2.6% |
| Puerto Ricans | 0.2 /100 | #274 | Tragic 2.6% |
| Immigrants | Dominican Republic | 0.2 /100 | #275 | Tragic 2.6% |
| Immigrants | Haiti | 0.1 /100 | #276 | Tragic 2.6% |
| Shoshone | 0.1 /100 | #277 | Tragic 2.6% |
| Cherokee | 0.1 /100 | #278 | Tragic 2.6% |
| Samoans | 0.1 /100 | #279 | Tragic 2.6% |
Demographics Similar to Albanians by Single Father Households
In terms of single father households, the demographic groups most similar to Albanians are Immigrants from Belgium (2.0%, a difference of 0.11%), Immigrants from St. Vincent and the Grenadines (2.0%, a difference of 0.13%), Immigrants from Australia (2.0%, a difference of 0.32%), Turkish (2.0%, a difference of 0.34%), and Immigrants from Eastern Europe (2.0%, a difference of 0.43%).
| Demographics | Rating | Rank | Single Father Households |
| Immigrants | Japan | 100.0 /100 | #28 | Exceptional 2.0% |
| Bulgarians | 100.0 /100 | #29 | Exceptional 2.0% |
| Cambodians | 100.0 /100 | #30 | Exceptional 2.0% |
| Israelis | 100.0 /100 | #31 | Exceptional 2.0% |
| Chinese | 100.0 /100 | #32 | Exceptional 2.0% |
| Turks | 100.0 /100 | #33 | Exceptional 2.0% |
| Immigrants | Australia | 100.0 /100 | #34 | Exceptional 2.0% |
| Albanians | 100.0 /100 | #35 | Exceptional 2.0% |
| Immigrants | Belgium | 100.0 /100 | #36 | Exceptional 2.0% |
| Immigrants | St. Vincent and the Grenadines | 100.0 /100 | #37 | Exceptional 2.0% |
| Immigrants | Eastern Europe | 100.0 /100 | #38 | Exceptional 2.0% |
| Immigrants | Sri Lanka | 100.0 /100 | #39 | Exceptional 2.0% |
| Immigrants | Bulgaria | 100.0 /100 | #40 | Exceptional 2.0% |
| Immigrants | Turkey | 100.0 /100 | #41 | Exceptional 2.0% |
| Macedonians | 100.0 /100 | #42 | Exceptional 2.0% |