Belizean vs Immigrants from Sudan In Labor Force | Age 20-24
COMPARE
Belizean
Immigrants from Sudan
In Labor Force | Age 20-24
In Labor Force | Age 20-24 Comparison
Belizeans
Immigrants from Sudan
73.4%
IN LABOR FORCE | AGE 20-24
0.3/ 100
METRIC RATING
272nd/ 347
METRIC RANK
76.8%
IN LABOR FORCE | AGE 20-24
99.8/ 100
METRIC RATING
69th/ 347
METRIC RANK
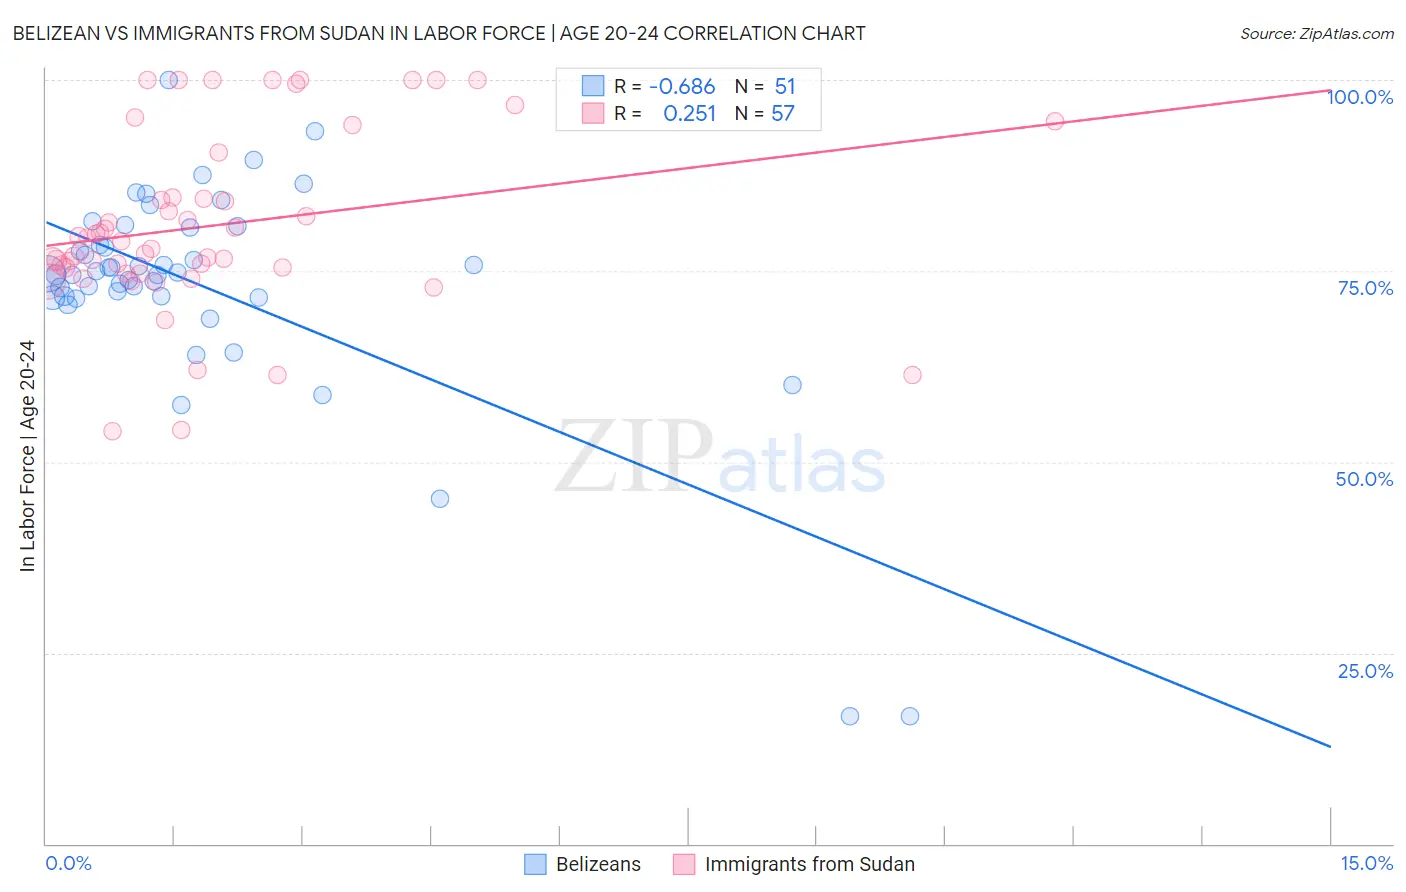
Belizean vs Immigrants from Sudan In Labor Force | Age 20-24 Correlation Chart
The statistical analysis conducted on geographies consisting of 144,207,582 people shows a significant negative correlation between the proportion of Belizeans and labor force participation rate among population between the ages 20 and 24 in the United States with a correlation coefficient (R) of -0.686 and weighted average of 73.4%. Similarly, the statistical analysis conducted on geographies consisting of 118,956,424 people shows a weak positive correlation between the proportion of Immigrants from Sudan and labor force participation rate among population between the ages 20 and 24 in the United States with a correlation coefficient (R) of 0.251 and weighted average of 76.8%, a difference of 4.6%.
In Labor Force | Age 20-24 Correlation Summary
| Measurement | Belizean | Immigrants from Sudan |
| Minimum | 16.7% | 54.0% |
| Maximum | 100.0% | 100.0% |
| Range | 83.3% | 46.0% |
| Mean | 73.0% | 81.0% |
| Median | 74.6% | 78.9% |
| Interquartile 25% (IQ1) | 71.5% | 75.0% |
| Interquartile 75% (IQ3) | 80.8% | 87.5% |
| Interquartile Range (IQR) | 9.3% | 12.5% |
| Standard Deviation (Sample) | 14.6% | 11.7% |
| Standard Deviation (Population) | 14.5% | 11.6% |
Similar Demographics by In Labor Force | Age 20-24
Demographics Similar to Belizeans by In Labor Force | Age 20-24
In terms of in labor force | age 20-24, the demographic groups most similar to Belizeans are Immigrants from Indonesia (73.4%, a difference of 0.010%), Cheyenne (73.4%, a difference of 0.030%), Immigrants from Colombia (73.4%, a difference of 0.050%), Immigrants from Russia (73.5%, a difference of 0.060%), and Colombian (73.5%, a difference of 0.10%).
| Demographics | Rating | Rank | In Labor Force | Age 20-24 |
| Burmese | 0.5 /100 | #265 | Tragic 73.6% |
| Haitians | 0.5 /100 | #266 | Tragic 73.6% |
| Immigrants | Western Asia | 0.4 /100 | #267 | Tragic 73.5% |
| South Americans | 0.4 /100 | #268 | Tragic 73.5% |
| Colombians | 0.3 /100 | #269 | Tragic 73.5% |
| Immigrants | Russia | 0.3 /100 | #270 | Tragic 73.5% |
| Immigrants | Indonesia | 0.3 /100 | #271 | Tragic 73.4% |
| Belizeans | 0.3 /100 | #272 | Tragic 73.4% |
| Cheyenne | 0.2 /100 | #273 | Tragic 73.4% |
| Immigrants | Colombia | 0.2 /100 | #274 | Tragic 73.4% |
| Immigrants | South America | 0.2 /100 | #275 | Tragic 73.3% |
| Mongolians | 0.2 /100 | #276 | Tragic 73.3% |
| Immigrants | Malaysia | 0.2 /100 | #277 | Tragic 73.3% |
| Cypriots | 0.2 /100 | #278 | Tragic 73.3% |
| Venezuelans | 0.2 /100 | #279 | Tragic 73.3% |
Demographics Similar to Immigrants from Sudan by In Labor Force | Age 20-24
In terms of in labor force | age 20-24, the demographic groups most similar to Immigrants from Sudan are Ottawa (76.8%, a difference of 0.010%), French American Indian (76.8%, a difference of 0.020%), Slavic (76.9%, a difference of 0.050%), Icelander (76.9%, a difference of 0.060%), and Crow (76.9%, a difference of 0.080%).
| Demographics | Rating | Rank | In Labor Force | Age 20-24 |
| Immigrants | Kenya | 99.9 /100 | #62 | Exceptional 77.0% |
| Lithuanians | 99.9 /100 | #63 | Exceptional 77.0% |
| Whites/Caucasians | 99.9 /100 | #64 | Exceptional 76.9% |
| Crow | 99.9 /100 | #65 | Exceptional 76.9% |
| Icelanders | 99.9 /100 | #66 | Exceptional 76.9% |
| Slavs | 99.9 /100 | #67 | Exceptional 76.9% |
| French American Indians | 99.8 /100 | #68 | Exceptional 76.8% |
| Immigrants | Sudan | 99.8 /100 | #69 | Exceptional 76.8% |
| Ottawa | 99.8 /100 | #70 | Exceptional 76.8% |
| Northern Europeans | 99.8 /100 | #71 | Exceptional 76.8% |
| Guamanians/Chamorros | 99.8 /100 | #72 | Exceptional 76.7% |
| British | 99.8 /100 | #73 | Exceptional 76.7% |
| Cree | 99.7 /100 | #74 | Exceptional 76.6% |
| Immigrants | Middle Africa | 99.7 /100 | #75 | Exceptional 76.6% |
| Immigrants | Moldova | 99.6 /100 | #76 | Exceptional 76.6% |