Belizean vs Immigrants from Ukraine Single Father Households
COMPARE
Belizean
Immigrants from Ukraine
Single Father Households
Single Father Households Comparison
Belizeans
Immigrants from Ukraine
2.6%
SINGLE FATHER HOUSEHOLDS
0.2/ 100
METRIC RATING
272nd/ 347
METRIC RANK
2.0%
SINGLE FATHER HOUSEHOLDS
99.9/ 100
METRIC RATING
47th/ 347
METRIC RANK
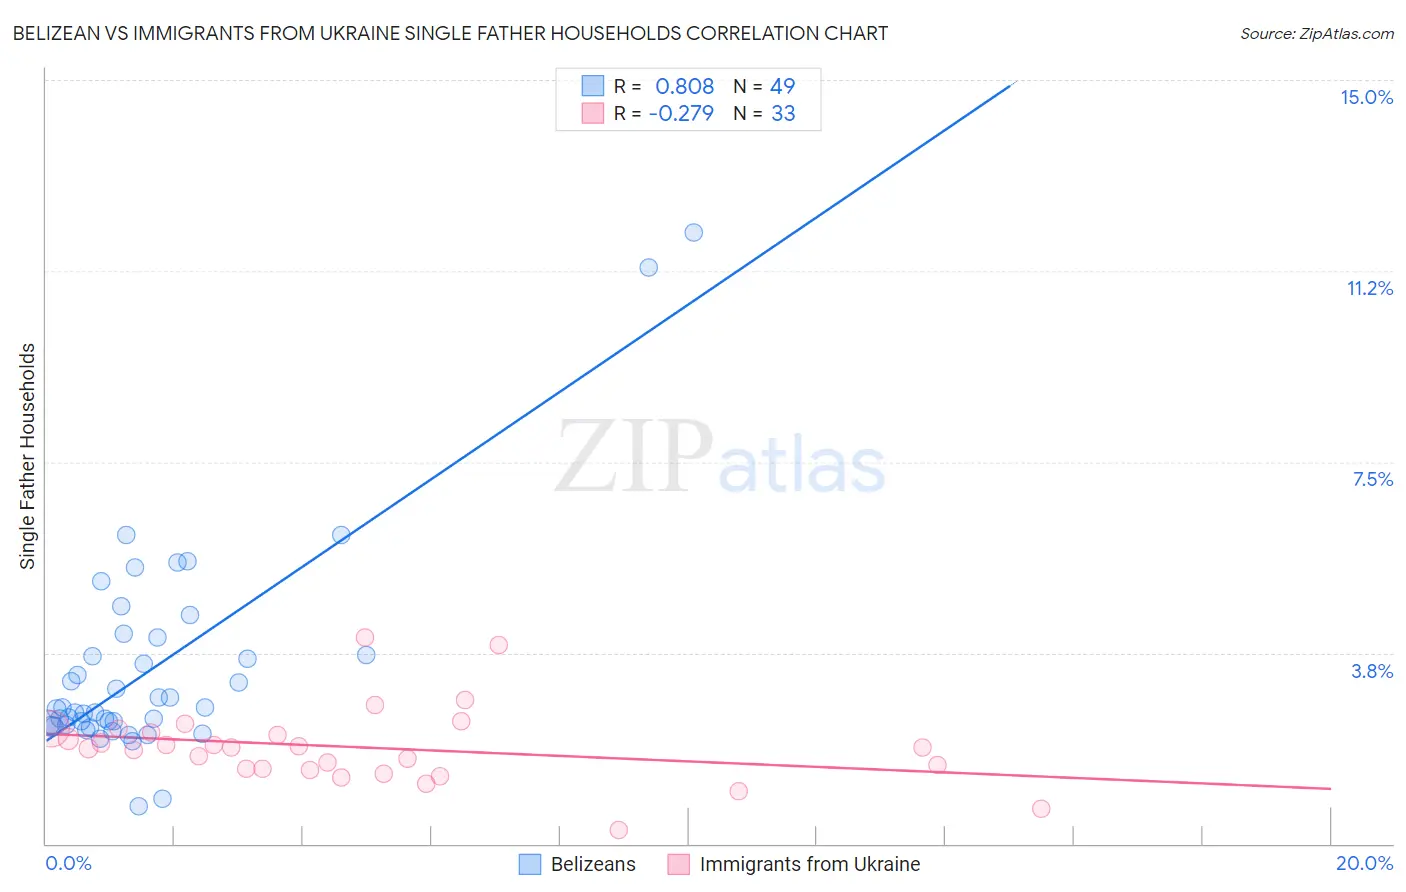
Belizean vs Immigrants from Ukraine Single Father Households Correlation Chart
The statistical analysis conducted on geographies consisting of 143,901,350 people shows a very strong positive correlation between the proportion of Belizeans and percentage of single father households in the United States with a correlation coefficient (R) of 0.808 and weighted average of 2.6%. Similarly, the statistical analysis conducted on geographies consisting of 287,847,219 people shows a weak negative correlation between the proportion of Immigrants from Ukraine and percentage of single father households in the United States with a correlation coefficient (R) of -0.279 and weighted average of 2.0%, a difference of 29.1%.
Single Father Households Correlation Summary
| Measurement | Belizean | Immigrants from Ukraine |
| Minimum | 0.75% | 0.28% |
| Maximum | 12.0% | 4.1% |
| Range | 11.3% | 3.8% |
| Mean | 3.4% | 1.9% |
| Median | 2.6% | 1.9% |
| Interquartile 25% (IQ1) | 2.3% | 1.5% |
| Interquartile 75% (IQ3) | 3.9% | 2.2% |
| Interquartile Range (IQR) | 1.6% | 0.77% |
| Standard Deviation (Sample) | 2.1% | 0.76% |
| Standard Deviation (Population) | 2.1% | 0.74% |
Similar Demographics by Single Father Households
Demographics Similar to Belizeans by Single Father Households
In terms of single father households, the demographic groups most similar to Belizeans are Creek (2.6%, a difference of 0.0%), Iroquois (2.6%, a difference of 0.040%), Puerto Rican (2.6%, a difference of 0.070%), Seminole (2.6%, a difference of 0.37%), and Immigrants from Dominican Republic (2.6%, a difference of 0.49%).
| Demographics | Rating | Rank | Single Father Households |
| Immigrants | Micronesia | 0.5 /100 | #265 | Tragic 2.6% |
| French American Indians | 0.5 /100 | #266 | Tragic 2.6% |
| Guamanians/Chamorros | 0.4 /100 | #267 | Tragic 2.6% |
| Haitians | 0.4 /100 | #268 | Tragic 2.6% |
| Cubans | 0.3 /100 | #269 | Tragic 2.6% |
| Seminole | 0.3 /100 | #270 | Tragic 2.6% |
| Creek | 0.2 /100 | #271 | Tragic 2.6% |
| Belizeans | 0.2 /100 | #272 | Tragic 2.6% |
| Iroquois | 0.2 /100 | #273 | Tragic 2.6% |
| Puerto Ricans | 0.2 /100 | #274 | Tragic 2.6% |
| Immigrants | Dominican Republic | 0.2 /100 | #275 | Tragic 2.6% |
| Immigrants | Haiti | 0.1 /100 | #276 | Tragic 2.6% |
| Shoshone | 0.1 /100 | #277 | Tragic 2.6% |
| Cherokee | 0.1 /100 | #278 | Tragic 2.6% |
| Samoans | 0.1 /100 | #279 | Tragic 2.6% |
Demographics Similar to Immigrants from Ukraine by Single Father Households
In terms of single father households, the demographic groups most similar to Immigrants from Ukraine are Immigrants from Kazakhstan (2.0%, a difference of 0.020%), Immigrants from Serbia (2.0%, a difference of 0.030%), Immigrants from Switzerland (2.0%, a difference of 0.040%), Immigrants from Poland (2.0%, a difference of 0.040%), and Immigrants from Europe (2.0%, a difference of 0.28%).
| Demographics | Rating | Rank | Single Father Households |
| Immigrants | Bulgaria | 100.0 /100 | #40 | Exceptional 2.0% |
| Immigrants | Turkey | 100.0 /100 | #41 | Exceptional 2.0% |
| Macedonians | 100.0 /100 | #42 | Exceptional 2.0% |
| Immigrants | Grenada | 100.0 /100 | #43 | Exceptional 2.0% |
| Latvians | 100.0 /100 | #44 | Exceptional 2.0% |
| Russians | 100.0 /100 | #45 | Exceptional 2.0% |
| Immigrants | Lebanon | 100.0 /100 | #46 | Exceptional 2.0% |
| Immigrants | Ukraine | 99.9 /100 | #47 | Exceptional 2.0% |
| Immigrants | Kazakhstan | 99.9 /100 | #48 | Exceptional 2.0% |
| Immigrants | Serbia | 99.9 /100 | #49 | Exceptional 2.0% |
| Immigrants | Switzerland | 99.9 /100 | #50 | Exceptional 2.0% |
| Immigrants | Poland | 99.9 /100 | #51 | Exceptional 2.0% |
| Immigrants | Europe | 99.9 /100 | #52 | Exceptional 2.0% |
| Immigrants | Northern Europe | 99.9 /100 | #53 | Exceptional 2.0% |
| Immigrants | Korea | 99.9 /100 | #54 | Exceptional 2.0% |