Belizean vs Aleut Single Father Households
COMPARE
Belizean
Aleut
Single Father Households
Single Father Households Comparison
Belizeans
Aleuts
2.6%
SINGLE FATHER HOUSEHOLDS
0.2/ 100
METRIC RATING
272nd/ 347
METRIC RANK
3.0%
SINGLE FATHER HOUSEHOLDS
0.0/ 100
METRIC RATING
326th/ 347
METRIC RANK
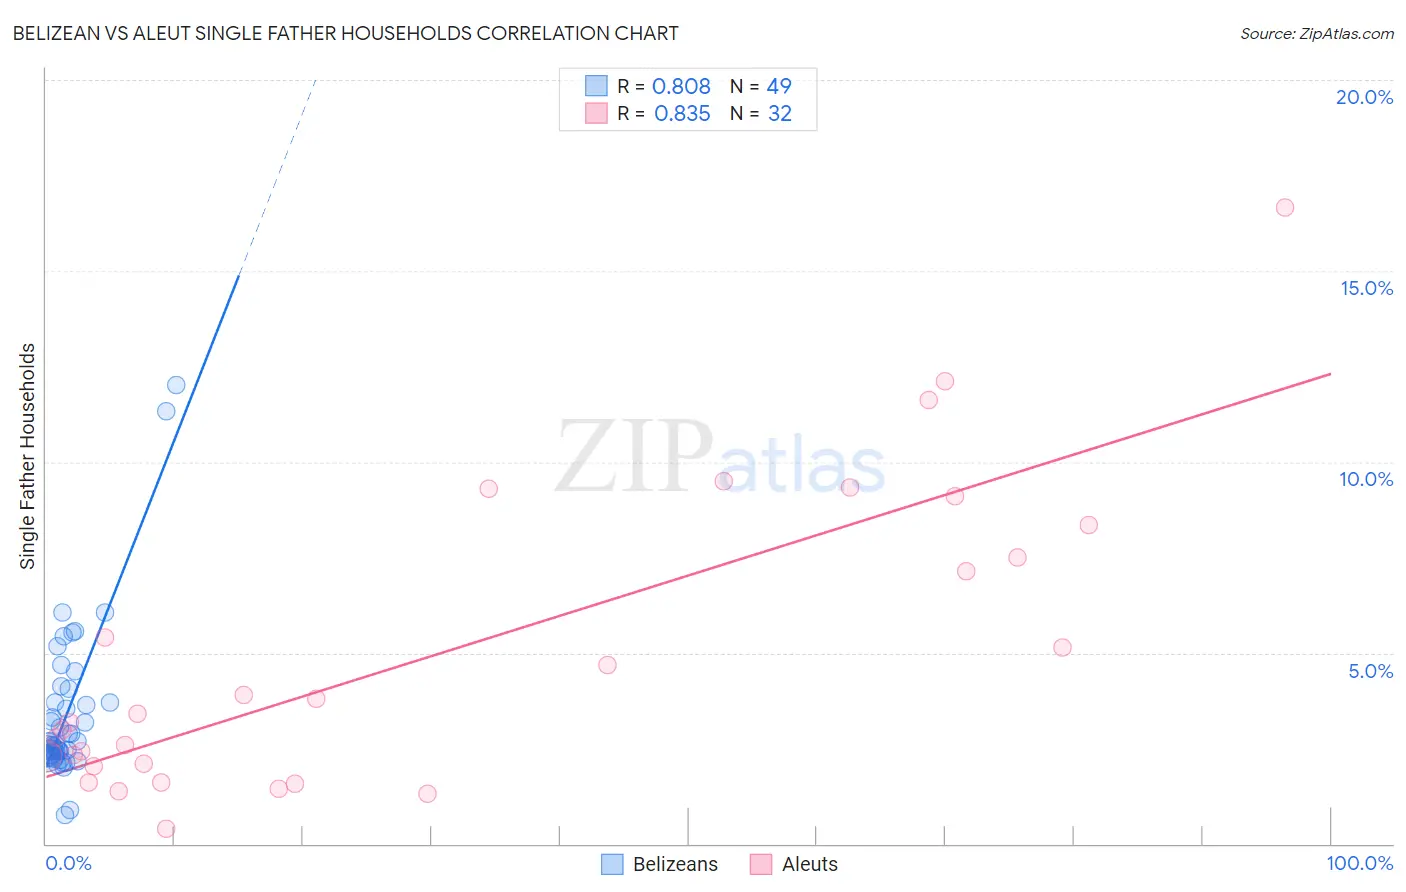
Belizean vs Aleut Single Father Households Correlation Chart
The statistical analysis conducted on geographies consisting of 143,901,350 people shows a very strong positive correlation between the proportion of Belizeans and percentage of single father households in the United States with a correlation coefficient (R) of 0.808 and weighted average of 2.6%. Similarly, the statistical analysis conducted on geographies consisting of 61,629,063 people shows a very strong positive correlation between the proportion of Aleuts and percentage of single father households in the United States with a correlation coefficient (R) of 0.835 and weighted average of 3.0%, a difference of 17.0%.
Single Father Households Correlation Summary
| Measurement | Belizean | Aleut |
| Minimum | 0.75% | 0.40% |
| Maximum | 12.0% | 16.7% |
| Range | 11.3% | 16.3% |
| Mean | 3.4% | 5.0% |
| Median | 2.6% | 3.3% |
| Interquartile 25% (IQ1) | 2.3% | 2.1% |
| Interquartile 75% (IQ3) | 3.9% | 7.9% |
| Interquartile Range (IQR) | 1.6% | 5.8% |
| Standard Deviation (Sample) | 2.1% | 4.0% |
| Standard Deviation (Population) | 2.1% | 3.9% |
Similar Demographics by Single Father Households
Demographics Similar to Belizeans by Single Father Households
In terms of single father households, the demographic groups most similar to Belizeans are Creek (2.6%, a difference of 0.0%), Iroquois (2.6%, a difference of 0.040%), Puerto Rican (2.6%, a difference of 0.070%), Seminole (2.6%, a difference of 0.37%), and Immigrants from Dominican Republic (2.6%, a difference of 0.49%).
| Demographics | Rating | Rank | Single Father Households |
| Immigrants | Micronesia | 0.5 /100 | #265 | Tragic 2.6% |
| French American Indians | 0.5 /100 | #266 | Tragic 2.6% |
| Guamanians/Chamorros | 0.4 /100 | #267 | Tragic 2.6% |
| Haitians | 0.4 /100 | #268 | Tragic 2.6% |
| Cubans | 0.3 /100 | #269 | Tragic 2.6% |
| Seminole | 0.3 /100 | #270 | Tragic 2.6% |
| Creek | 0.2 /100 | #271 | Tragic 2.6% |
| Belizeans | 0.2 /100 | #272 | Tragic 2.6% |
| Iroquois | 0.2 /100 | #273 | Tragic 2.6% |
| Puerto Ricans | 0.2 /100 | #274 | Tragic 2.6% |
| Immigrants | Dominican Republic | 0.2 /100 | #275 | Tragic 2.6% |
| Immigrants | Haiti | 0.1 /100 | #276 | Tragic 2.6% |
| Shoshone | 0.1 /100 | #277 | Tragic 2.6% |
| Cherokee | 0.1 /100 | #278 | Tragic 2.6% |
| Samoans | 0.1 /100 | #279 | Tragic 2.6% |
Demographics Similar to Aleuts by Single Father Households
In terms of single father households, the demographic groups most similar to Aleuts are Immigrants from Mexico (3.0%, a difference of 0.19%), Bangladeshi (3.1%, a difference of 0.88%), Fijian (3.0%, a difference of 1.4%), Immigrants from Cabo Verde (3.1%, a difference of 1.4%), and Immigrants from Central America (3.0%, a difference of 1.5%).
| Demographics | Rating | Rank | Single Father Households |
| Ute | 0.0 /100 | #319 | Tragic 3.0% |
| Guatemalans | 0.0 /100 | #320 | Tragic 3.0% |
| Mexicans | 0.0 /100 | #321 | Tragic 3.0% |
| Immigrants | Guatemala | 0.0 /100 | #322 | Tragic 3.0% |
| Immigrants | Central America | 0.0 /100 | #323 | Tragic 3.0% |
| Fijians | 0.0 /100 | #324 | Tragic 3.0% |
| Immigrants | Mexico | 0.0 /100 | #325 | Tragic 3.0% |
| Aleuts | 0.0 /100 | #326 | Tragic 3.0% |
| Bangladeshis | 0.0 /100 | #327 | Tragic 3.1% |
| Immigrants | Cabo Verde | 0.0 /100 | #328 | Tragic 3.1% |
| Chippewa | 0.0 /100 | #329 | Tragic 3.1% |
| Nepalese | 0.0 /100 | #330 | Tragic 3.1% |
| Navajo | 0.0 /100 | #331 | Tragic 3.2% |
| Yaqui | 0.0 /100 | #332 | Tragic 3.2% |
| Natives/Alaskans | 0.0 /100 | #333 | Tragic 3.2% |