Belizean vs Palestinian Single Father Households
COMPARE
Belizean
Palestinian
Single Father Households
Single Father Households Comparison
Belizeans
Palestinians
2.6%
SINGLE FATHER HOUSEHOLDS
0.2/ 100
METRIC RATING
272nd/ 347
METRIC RANK
2.2%
SINGLE FATHER HOUSEHOLDS
98.6/ 100
METRIC RATING
105th/ 347
METRIC RANK
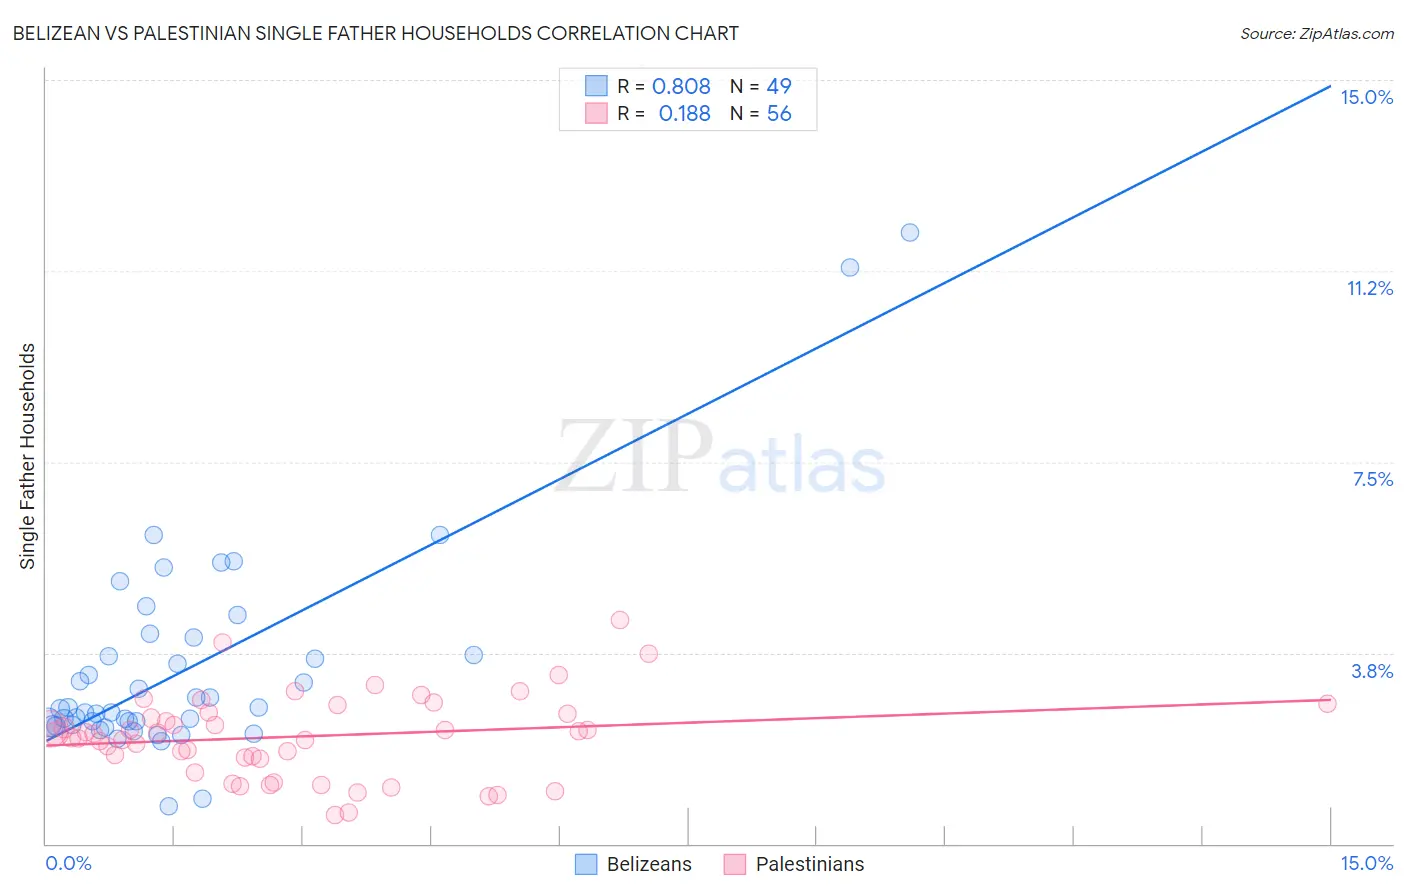
Belizean vs Palestinian Single Father Households Correlation Chart
The statistical analysis conducted on geographies consisting of 143,901,350 people shows a very strong positive correlation between the proportion of Belizeans and percentage of single father households in the United States with a correlation coefficient (R) of 0.808 and weighted average of 2.6%. Similarly, the statistical analysis conducted on geographies consisting of 215,869,880 people shows a poor positive correlation between the proportion of Palestinians and percentage of single father households in the United States with a correlation coefficient (R) of 0.188 and weighted average of 2.2%, a difference of 20.8%.
Single Father Households Correlation Summary
| Measurement | Belizean | Palestinian |
| Minimum | 0.75% | 0.57% |
| Maximum | 12.0% | 4.4% |
| Range | 11.3% | 3.8% |
| Mean | 3.4% | 2.1% |
| Median | 2.6% | 2.2% |
| Interquartile 25% (IQ1) | 2.3% | 1.7% |
| Interquartile 75% (IQ3) | 3.9% | 2.6% |
| Interquartile Range (IQR) | 1.6% | 0.88% |
| Standard Deviation (Sample) | 2.1% | 0.81% |
| Standard Deviation (Population) | 2.1% | 0.80% |
Similar Demographics by Single Father Households
Demographics Similar to Belizeans by Single Father Households
In terms of single father households, the demographic groups most similar to Belizeans are Creek (2.6%, a difference of 0.0%), Iroquois (2.6%, a difference of 0.040%), Puerto Rican (2.6%, a difference of 0.070%), Seminole (2.6%, a difference of 0.37%), and Immigrants from Dominican Republic (2.6%, a difference of 0.49%).
| Demographics | Rating | Rank | Single Father Households |
| Immigrants | Micronesia | 0.5 /100 | #265 | Tragic 2.6% |
| French American Indians | 0.5 /100 | #266 | Tragic 2.6% |
| Guamanians/Chamorros | 0.4 /100 | #267 | Tragic 2.6% |
| Haitians | 0.4 /100 | #268 | Tragic 2.6% |
| Cubans | 0.3 /100 | #269 | Tragic 2.6% |
| Seminole | 0.3 /100 | #270 | Tragic 2.6% |
| Creek | 0.2 /100 | #271 | Tragic 2.6% |
| Belizeans | 0.2 /100 | #272 | Tragic 2.6% |
| Iroquois | 0.2 /100 | #273 | Tragic 2.6% |
| Puerto Ricans | 0.2 /100 | #274 | Tragic 2.6% |
| Immigrants | Dominican Republic | 0.2 /100 | #275 | Tragic 2.6% |
| Immigrants | Haiti | 0.1 /100 | #276 | Tragic 2.6% |
| Shoshone | 0.1 /100 | #277 | Tragic 2.6% |
| Cherokee | 0.1 /100 | #278 | Tragic 2.6% |
| Samoans | 0.1 /100 | #279 | Tragic 2.6% |
Demographics Similar to Palestinians by Single Father Households
In terms of single father households, the demographic groups most similar to Palestinians are Immigrants from Southern Europe (2.2%, a difference of 0.11%), Slovene (2.2%, a difference of 0.23%), Immigrants from Netherlands (2.2%, a difference of 0.25%), Barbadian (2.2%, a difference of 0.29%), and Alsatian (2.1%, a difference of 0.37%).
| Demographics | Rating | Rank | Single Father Households |
| Guyanese | 99.1 /100 | #98 | Exceptional 2.1% |
| South Africans | 99.1 /100 | #99 | Exceptional 2.1% |
| Immigrants | Northern Africa | 99.0 /100 | #100 | Exceptional 2.1% |
| Immigrants | Western Europe | 98.9 /100 | #101 | Exceptional 2.1% |
| Argentineans | 98.9 /100 | #102 | Exceptional 2.1% |
| Lebanese | 98.9 /100 | #103 | Exceptional 2.1% |
| Alsatians | 98.9 /100 | #104 | Exceptional 2.1% |
| Palestinians | 98.6 /100 | #105 | Exceptional 2.2% |
| Immigrants | Southern Europe | 98.6 /100 | #106 | Exceptional 2.2% |
| Slovenes | 98.5 /100 | #107 | Exceptional 2.2% |
| Immigrants | Netherlands | 98.5 /100 | #108 | Exceptional 2.2% |
| Barbadians | 98.4 /100 | #109 | Exceptional 2.2% |
| Italians | 98.3 /100 | #110 | Exceptional 2.2% |
| Immigrants | Canada | 98.3 /100 | #111 | Exceptional 2.2% |
| Immigrants | Trinidad and Tobago | 98.2 /100 | #112 | Exceptional 2.2% |