Belizean vs Immigrants from Sudan Professional Degree
COMPARE
Belizean
Immigrants from Sudan
Professional Degree
Professional Degree Comparison
Belizeans
Immigrants from Sudan
3.6%
PROFESSIONAL DEGREE
0.5/ 100
METRIC RATING
271st/ 347
METRIC RANK
4.9%
PROFESSIONAL DEGREE
95.4/ 100
METRIC RATING
119th/ 347
METRIC RANK
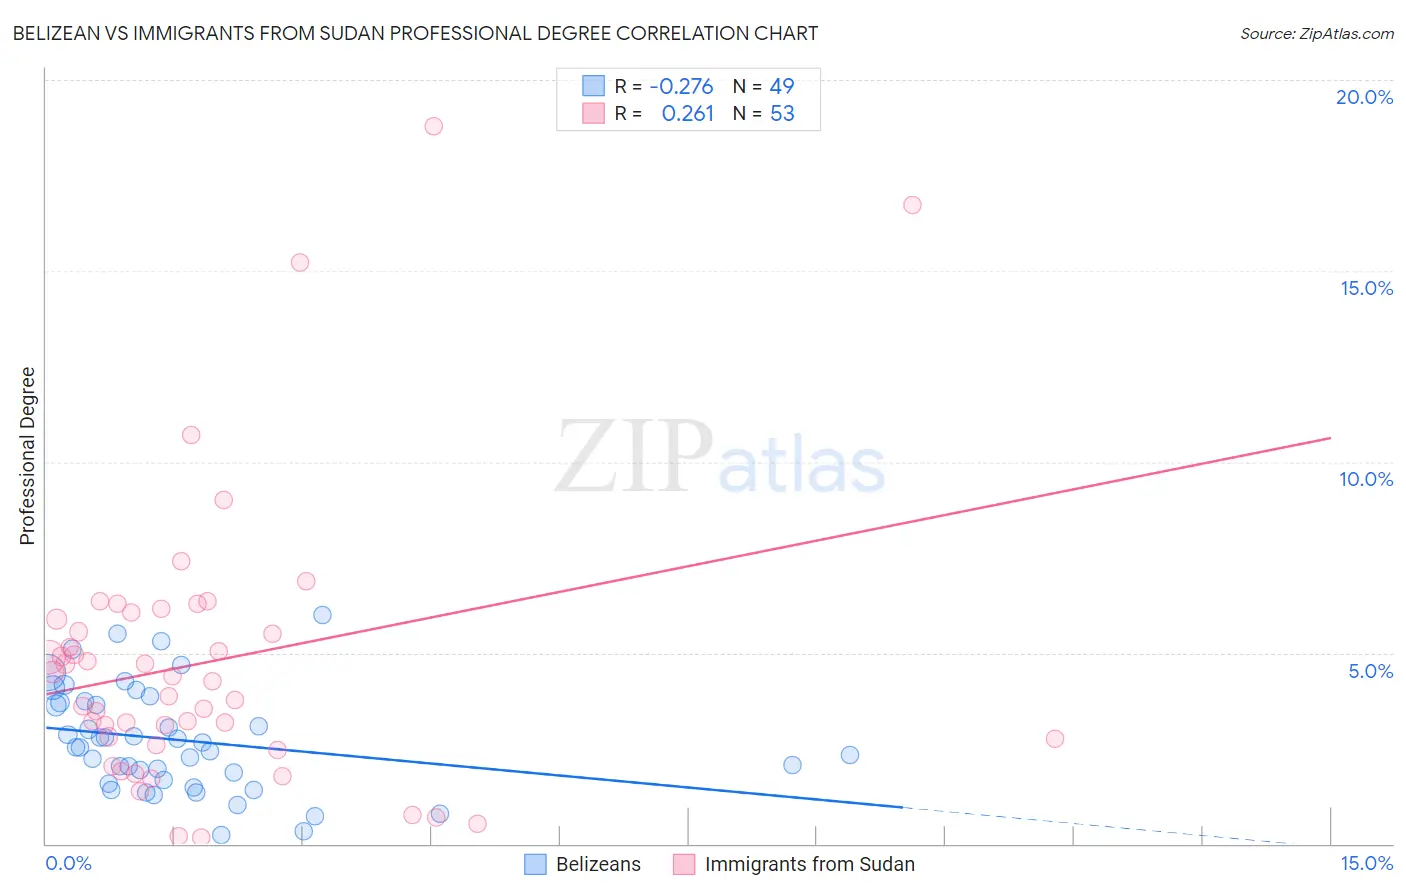
Belizean vs Immigrants from Sudan Professional Degree Correlation Chart
The statistical analysis conducted on geographies consisting of 144,093,720 people shows a weak negative correlation between the proportion of Belizeans and percentage of population with at least professional degree education in the United States with a correlation coefficient (R) of -0.276 and weighted average of 3.6%. Similarly, the statistical analysis conducted on geographies consisting of 118,905,471 people shows a weak positive correlation between the proportion of Immigrants from Sudan and percentage of population with at least professional degree education in the United States with a correlation coefficient (R) of 0.261 and weighted average of 4.9%, a difference of 37.0%.
Professional Degree Correlation Summary
| Measurement | Belizean | Immigrants from Sudan |
| Minimum | 0.21% | 0.17% |
| Maximum | 6.0% | 18.8% |
| Range | 5.8% | 18.6% |
| Mean | 2.7% | 4.8% |
| Median | 2.5% | 4.2% |
| Interquartile 25% (IQ1) | 1.6% | 2.7% |
| Interquartile 75% (IQ3) | 3.7% | 6.0% |
| Interquartile Range (IQR) | 2.1% | 3.3% |
| Standard Deviation (Sample) | 1.4% | 3.7% |
| Standard Deviation (Population) | 1.4% | 3.7% |
Similar Demographics by Professional Degree
Demographics Similar to Belizeans by Professional Degree
In terms of professional degree, the demographic groups most similar to Belizeans are Immigrants from Jamaica (3.6%, a difference of 0.030%), American (3.6%, a difference of 0.090%), Potawatomi (3.6%, a difference of 0.22%), Immigrants from Dominica (3.6%, a difference of 0.45%), and Central American (3.6%, a difference of 0.47%).
| Demographics | Rating | Rank | Professional Degree |
| Immigrants | Cambodia | 0.9 /100 | #264 | Tragic 3.6% |
| Immigrants | Congo | 0.8 /100 | #265 | Tragic 3.6% |
| Central American Indians | 0.8 /100 | #266 | Tragic 3.6% |
| Delaware | 0.7 /100 | #267 | Tragic 3.6% |
| Aleuts | 0.7 /100 | #268 | Tragic 3.6% |
| Immigrants | Cuba | 0.6 /100 | #269 | Tragic 3.6% |
| Central Americans | 0.6 /100 | #270 | Tragic 3.6% |
| Belizeans | 0.5 /100 | #271 | Tragic 3.6% |
| Immigrants | Jamaica | 0.5 /100 | #272 | Tragic 3.6% |
| Americans | 0.5 /100 | #273 | Tragic 3.6% |
| Potawatomi | 0.5 /100 | #274 | Tragic 3.6% |
| Immigrants | Dominica | 0.5 /100 | #275 | Tragic 3.6% |
| Liberians | 0.5 /100 | #276 | Tragic 3.6% |
| Cheyenne | 0.5 /100 | #277 | Tragic 3.6% |
| Japanese | 0.5 /100 | #278 | Tragic 3.5% |
Demographics Similar to Immigrants from Sudan by Professional Degree
In terms of professional degree, the demographic groups most similar to Immigrants from Sudan are Albanian (4.9%, a difference of 0.010%), Immigrants from Moldova (4.9%, a difference of 0.36%), Immigrants from Syria (4.9%, a difference of 0.54%), Croatian (4.9%, a difference of 0.54%), and Venezuelan (4.9%, a difference of 0.75%).
| Demographics | Rating | Rank | Professional Degree |
| Taiwanese | 97.3 /100 | #112 | Exceptional 5.0% |
| Immigrants | Pakistan | 97.2 /100 | #113 | Exceptional 5.0% |
| Immigrants | Morocco | 96.8 /100 | #114 | Exceptional 5.0% |
| Moroccans | 96.8 /100 | #115 | Exceptional 5.0% |
| Venezuelans | 96.3 /100 | #116 | Exceptional 4.9% |
| Immigrants | Syria | 96.0 /100 | #117 | Exceptional 4.9% |
| Croatians | 96.0 /100 | #118 | Exceptional 4.9% |
| Immigrants | Sudan | 95.4 /100 | #119 | Exceptional 4.9% |
| Albanians | 95.3 /100 | #120 | Exceptional 4.9% |
| Immigrants | Moldova | 94.8 /100 | #121 | Exceptional 4.9% |
| Immigrants | Germany | 94.1 /100 | #122 | Exceptional 4.9% |
| Immigrants | Venezuela | 93.8 /100 | #123 | Exceptional 4.8% |
| Immigrants | Eritrea | 93.5 /100 | #124 | Exceptional 4.8% |
| Immigrants | Albania | 93.3 /100 | #125 | Exceptional 4.8% |
| Europeans | 93.2 /100 | #126 | Exceptional 4.8% |