Ecuadorian vs Immigrants from Sudan Single Father Households
COMPARE
Ecuadorian
Immigrants from Sudan
Single Father Households
Single Father Households Comparison
Ecuadorians
Immigrants from Sudan
2.4%
SINGLE FATHER HOUSEHOLDS
24.5/ 100
METRIC RATING
204th/ 347
METRIC RANK
2.4%
SINGLE FATHER HOUSEHOLDS
29.8/ 100
METRIC RATING
192nd/ 347
METRIC RANK
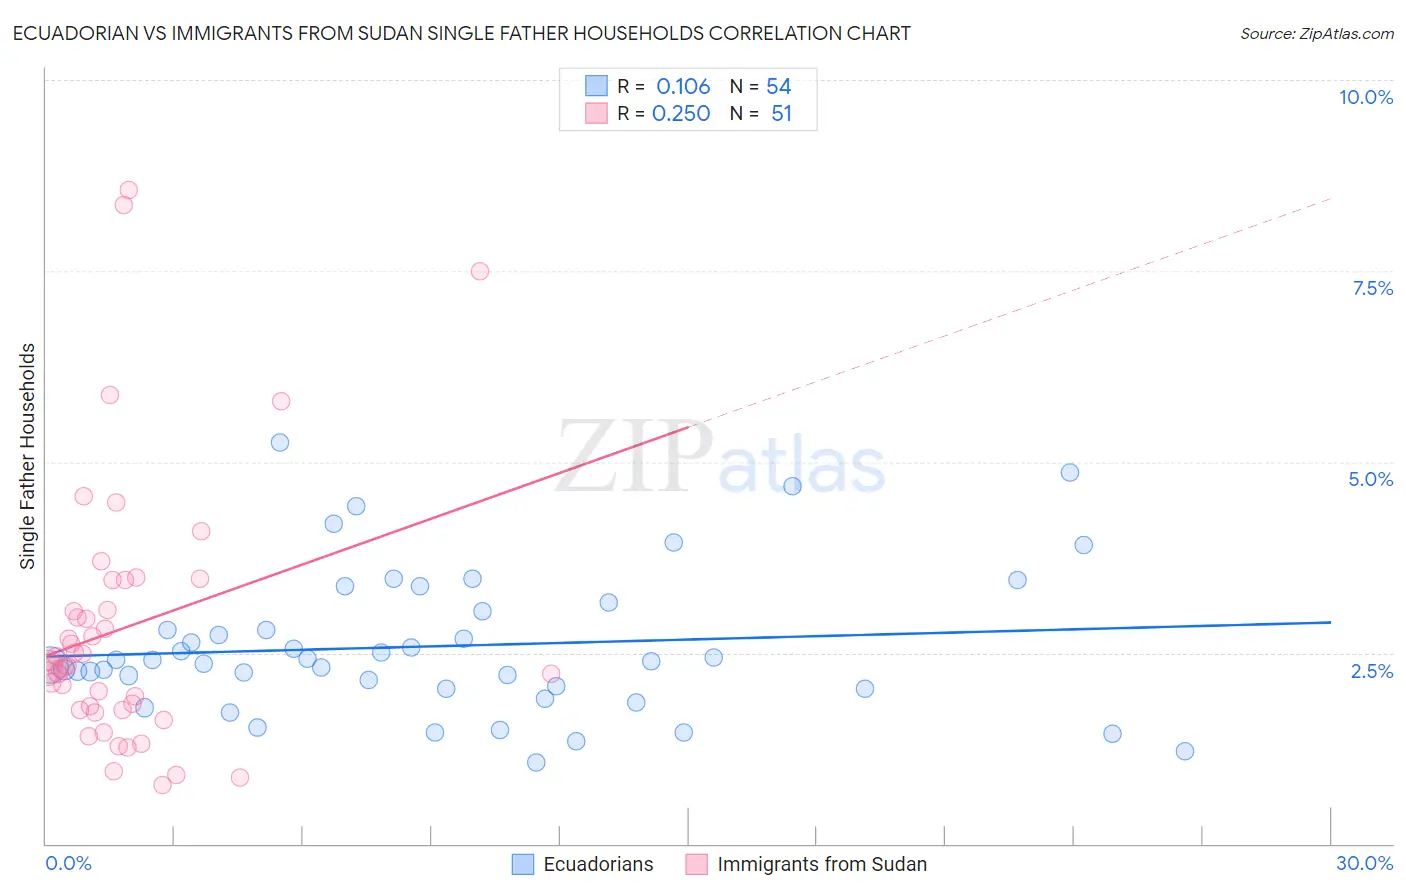
Ecuadorian vs Immigrants from Sudan Single Father Households Correlation Chart
The statistical analysis conducted on geographies consisting of 315,595,316 people shows a poor positive correlation between the proportion of Ecuadorians and percentage of single father households in the United States with a correlation coefficient (R) of 0.106 and weighted average of 2.4%. Similarly, the statistical analysis conducted on geographies consisting of 118,770,797 people shows a weak positive correlation between the proportion of Immigrants from Sudan and percentage of single father households in the United States with a correlation coefficient (R) of 0.250 and weighted average of 2.4%, a difference of 0.49%.
Single Father Households Correlation Summary
| Measurement | Ecuadorian | Immigrants from Sudan |
| Minimum | 1.1% | 0.77% |
| Maximum | 5.3% | 8.6% |
| Range | 4.2% | 7.8% |
| Mean | 2.6% | 2.8% |
| Median | 2.4% | 2.4% |
| Interquartile 25% (IQ1) | 2.0% | 1.8% |
| Interquartile 75% (IQ3) | 3.0% | 3.4% |
| Interquartile Range (IQR) | 1.0% | 1.7% |
| Standard Deviation (Sample) | 0.94% | 1.7% |
| Standard Deviation (Population) | 0.93% | 1.7% |
Demographics Similar to Ecuadorians and Immigrants from Sudan by Single Father Households
In terms of single father households, the demographic groups most similar to Ecuadorians are French Canadian (2.4%, a difference of 0.020%), Immigrants from Afghanistan (2.4%, a difference of 0.030%), Korean (2.4%, a difference of 0.030%), German Russian (2.4%, a difference of 0.12%), and Immigrants from Uganda (2.4%, a difference of 0.15%). Similarly, the demographic groups most similar to Immigrants from Sudan are Immigrants from Africa (2.4%, a difference of 0.010%), Uruguayan (2.4%, a difference of 0.010%), Panamanian (2.4%, a difference of 0.020%), Immigrants from Philippines (2.4%, a difference of 0.10%), and Kenyan (2.4%, a difference of 0.15%).
| Demographics | Rating | Rank | Single Father Households |
| Hmong | 33.0 /100 | #188 | Fair 2.4% |
| U.S. Virgin Islanders | 31.8 /100 | #189 | Fair 2.4% |
| French | 31.7 /100 | #190 | Fair 2.4% |
| Immigrants | Africa | 30.0 /100 | #191 | Fair 2.4% |
| Immigrants | Sudan | 29.8 /100 | #192 | Fair 2.4% |
| Uruguayans | 29.7 /100 | #193 | Fair 2.4% |
| Panamanians | 29.6 /100 | #194 | Fair 2.4% |
| Immigrants | Philippines | 28.7 /100 | #195 | Fair 2.4% |
| Kenyans | 28.0 /100 | #196 | Fair 2.4% |
| Germans | 28.0 /100 | #197 | Fair 2.4% |
| Scandinavians | 27.4 /100 | #198 | Fair 2.4% |
| Immigrants | Vietnam | 27.1 /100 | #199 | Fair 2.4% |
| Peruvians | 27.1 /100 | #200 | Fair 2.4% |
| Immigrants | Uganda | 26.0 /100 | #201 | Fair 2.4% |
| German Russians | 25.7 /100 | #202 | Fair 2.4% |
| French Canadians | 24.7 /100 | #203 | Fair 2.4% |
| Ecuadorians | 24.5 /100 | #204 | Fair 2.4% |
| Immigrants | Afghanistan | 24.2 /100 | #205 | Fair 2.4% |
| Koreans | 24.1 /100 | #206 | Fair 2.4% |
| Whites/Caucasians | 22.6 /100 | #207 | Fair 2.4% |
| Immigrants | Kenya | 20.3 /100 | #208 | Fair 2.4% |