Luxembourger vs Immigrants from Sudan Single Father Households
COMPARE
Luxembourger
Immigrants from Sudan
Single Father Households
Single Father Households Comparison
Luxembourgers
Immigrants from Sudan
2.2%
SINGLE FATHER HOUSEHOLDS
92.3/ 100
METRIC RATING
142nd/ 347
METRIC RANK
2.4%
SINGLE FATHER HOUSEHOLDS
29.8/ 100
METRIC RATING
192nd/ 347
METRIC RANK
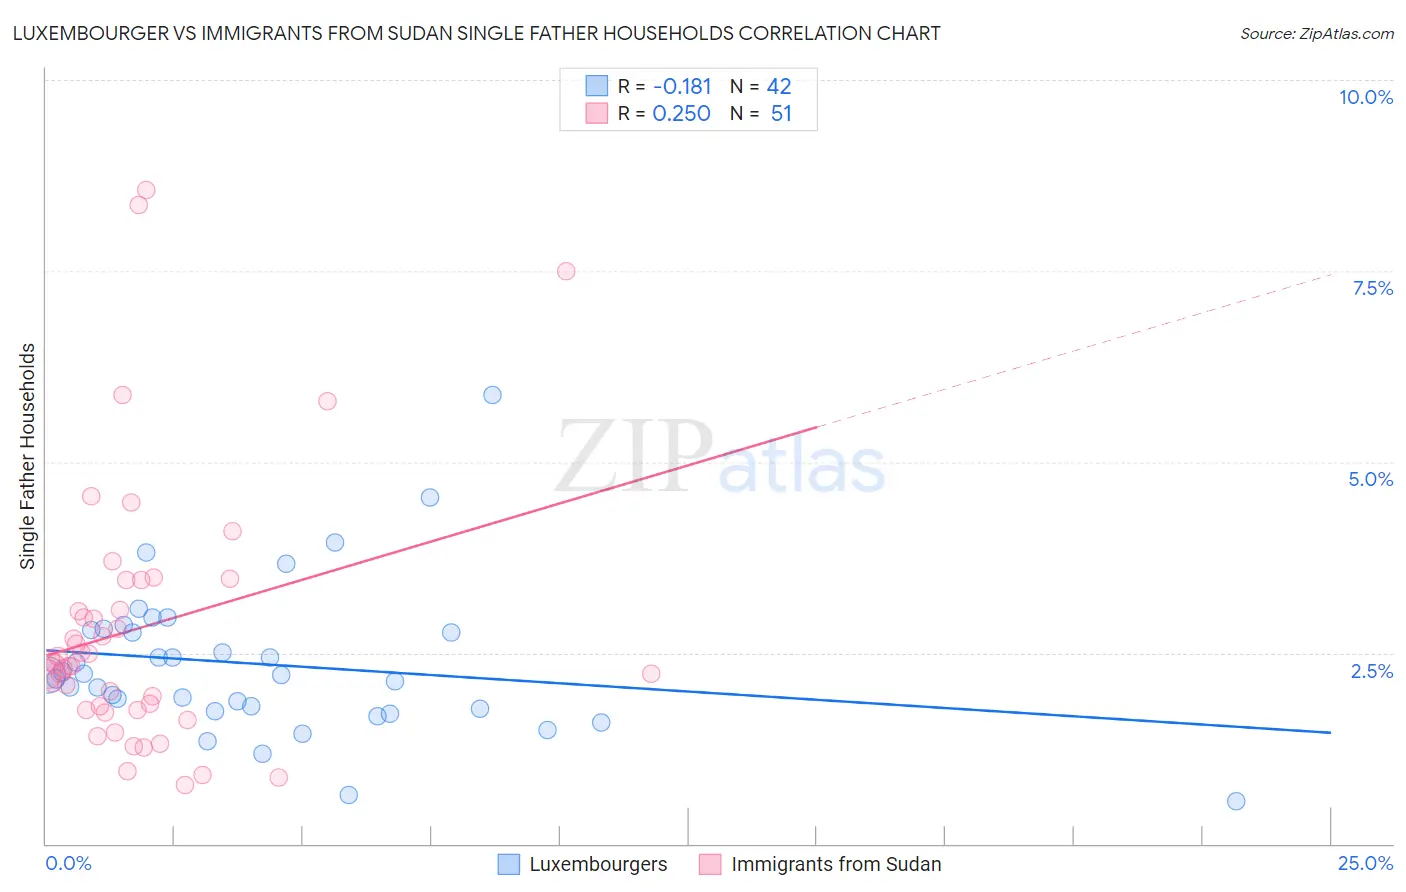
Luxembourger vs Immigrants from Sudan Single Father Households Correlation Chart
The statistical analysis conducted on geographies consisting of 143,992,670 people shows a poor negative correlation between the proportion of Luxembourgers and percentage of single father households in the United States with a correlation coefficient (R) of -0.181 and weighted average of 2.2%. Similarly, the statistical analysis conducted on geographies consisting of 118,770,797 people shows a weak positive correlation between the proportion of Immigrants from Sudan and percentage of single father households in the United States with a correlation coefficient (R) of 0.250 and weighted average of 2.4%, a difference of 6.4%.
Single Father Households Correlation Summary
| Measurement | Luxembourger | Immigrants from Sudan |
| Minimum | 0.55% | 0.77% |
| Maximum | 5.9% | 8.6% |
| Range | 5.3% | 7.8% |
| Mean | 2.4% | 2.8% |
| Median | 2.2% | 2.4% |
| Interquartile 25% (IQ1) | 1.8% | 1.8% |
| Interquartile 75% (IQ3) | 2.8% | 3.4% |
| Interquartile Range (IQR) | 1.0% | 1.7% |
| Standard Deviation (Sample) | 0.98% | 1.7% |
| Standard Deviation (Population) | 0.97% | 1.7% |
Similar Demographics by Single Father Households
Demographics Similar to Luxembourgers by Single Father Households
In terms of single father households, the demographic groups most similar to Luxembourgers are Laotian (2.2%, a difference of 0.040%), Immigrants from Nepal (2.2%, a difference of 0.060%), Brazilian (2.2%, a difference of 0.13%), British (2.2%, a difference of 0.13%), and Slovak (2.2%, a difference of 0.40%).
| Demographics | Rating | Rank | Single Father Households |
| Syrians | 94.8 /100 | #135 | Exceptional 2.2% |
| Chileans | 94.5 /100 | #136 | Exceptional 2.2% |
| Austrians | 94.2 /100 | #137 | Exceptional 2.2% |
| West Indians | 94.1 /100 | #138 | Exceptional 2.2% |
| Brazilians | 92.8 /100 | #139 | Exceptional 2.2% |
| British | 92.8 /100 | #140 | Exceptional 2.2% |
| Laotians | 92.5 /100 | #141 | Exceptional 2.2% |
| Luxembourgers | 92.3 /100 | #142 | Exceptional 2.2% |
| Immigrants | Nepal | 92.1 /100 | #143 | Exceptional 2.2% |
| Slovaks | 90.7 /100 | #144 | Exceptional 2.2% |
| Immigrants | Zimbabwe | 90.2 /100 | #145 | Exceptional 2.2% |
| Northern Europeans | 89.8 /100 | #146 | Excellent 2.2% |
| Slavs | 88.9 /100 | #147 | Excellent 2.2% |
| South American Indians | 88.5 /100 | #148 | Excellent 2.3% |
| Senegalese | 88.4 /100 | #149 | Excellent 2.3% |
Demographics Similar to Immigrants from Sudan by Single Father Households
In terms of single father households, the demographic groups most similar to Immigrants from Sudan are Immigrants from Africa (2.4%, a difference of 0.010%), Uruguayan (2.4%, a difference of 0.010%), Panamanian (2.4%, a difference of 0.020%), Immigrants from Philippines (2.4%, a difference of 0.10%), and Kenyan (2.4%, a difference of 0.15%).
| Demographics | Rating | Rank | Single Father Households |
| Nigerians | 41.0 /100 | #185 | Average 2.4% |
| Immigrants | Bosnia and Herzegovina | 40.4 /100 | #186 | Average 2.4% |
| Immigrants | Colombia | 34.0 /100 | #187 | Fair 2.4% |
| Hmong | 33.0 /100 | #188 | Fair 2.4% |
| U.S. Virgin Islanders | 31.8 /100 | #189 | Fair 2.4% |
| French | 31.7 /100 | #190 | Fair 2.4% |
| Immigrants | Africa | 30.0 /100 | #191 | Fair 2.4% |
| Immigrants | Sudan | 29.8 /100 | #192 | Fair 2.4% |
| Uruguayans | 29.7 /100 | #193 | Fair 2.4% |
| Panamanians | 29.6 /100 | #194 | Fair 2.4% |
| Immigrants | Philippines | 28.7 /100 | #195 | Fair 2.4% |
| Kenyans | 28.0 /100 | #196 | Fair 2.4% |
| Germans | 28.0 /100 | #197 | Fair 2.4% |
| Scandinavians | 27.4 /100 | #198 | Fair 2.4% |
| Immigrants | Vietnam | 27.1 /100 | #199 | Fair 2.4% |