Immigrants from Egypt vs Immigrants from Sudan Single Father Households
COMPARE
Immigrants from Egypt
Immigrants from Sudan
Single Father Households
Single Father Households Comparison
Immigrants from Egypt
Immigrants from Sudan
2.1%
SINGLE FATHER HOUSEHOLDS
99.8/ 100
METRIC RATING
74th/ 347
METRIC RANK
2.4%
SINGLE FATHER HOUSEHOLDS
29.8/ 100
METRIC RATING
192nd/ 347
METRIC RANK
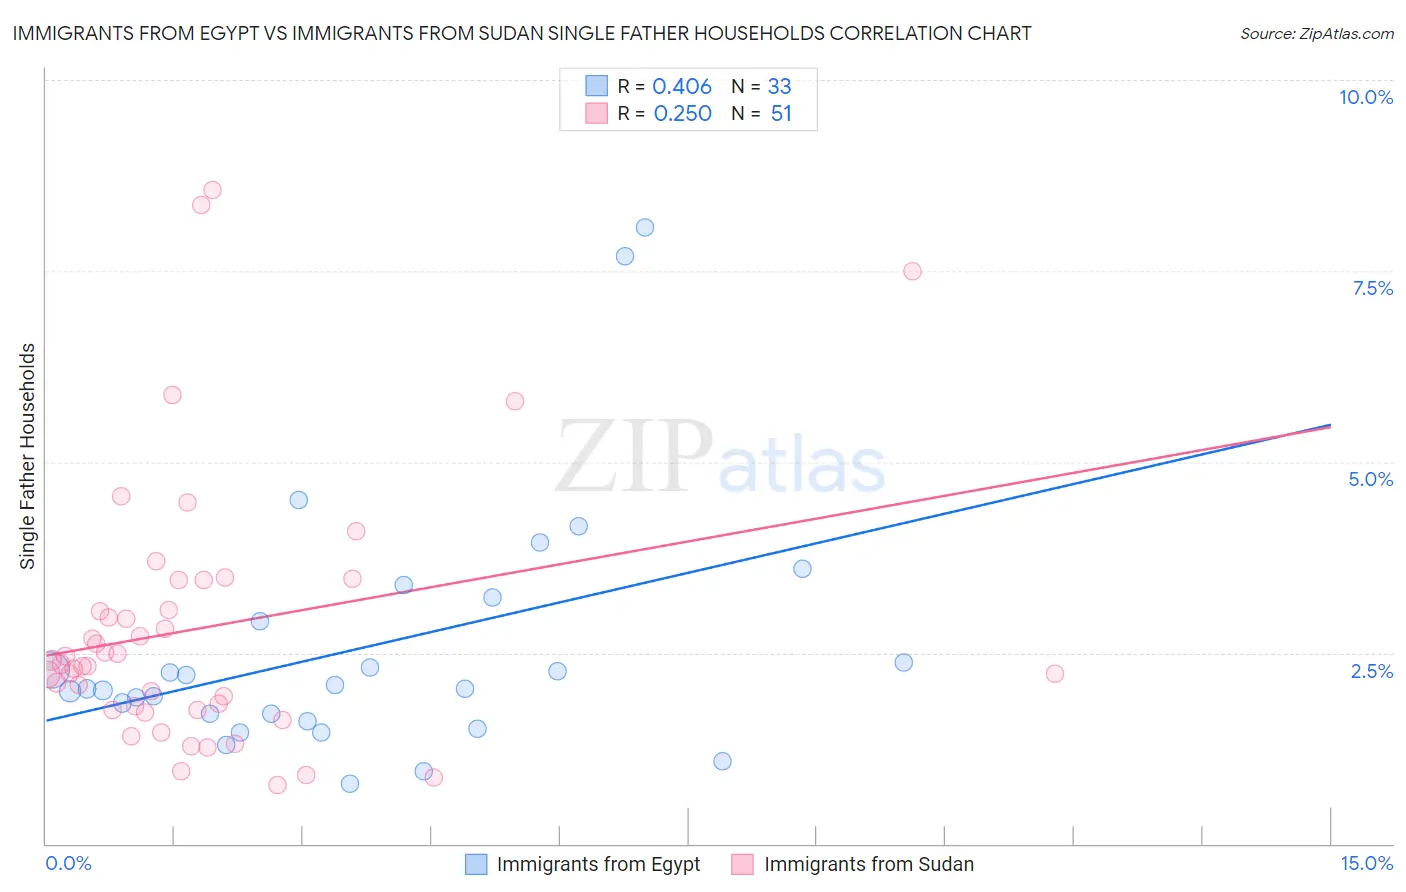
Immigrants from Egypt vs Immigrants from Sudan Single Father Households Correlation Chart
The statistical analysis conducted on geographies consisting of 244,264,821 people shows a moderate positive correlation between the proportion of Immigrants from Egypt and percentage of single father households in the United States with a correlation coefficient (R) of 0.406 and weighted average of 2.1%. Similarly, the statistical analysis conducted on geographies consisting of 118,770,797 people shows a weak positive correlation between the proportion of Immigrants from Sudan and percentage of single father households in the United States with a correlation coefficient (R) of 0.250 and weighted average of 2.4%, a difference of 14.7%.
Single Father Households Correlation Summary
| Measurement | Immigrants from Egypt | Immigrants from Sudan |
| Minimum | 0.78% | 0.77% |
| Maximum | 8.1% | 8.6% |
| Range | 7.3% | 7.8% |
| Mean | 2.6% | 2.8% |
| Median | 2.0% | 2.4% |
| Interquartile 25% (IQ1) | 1.7% | 1.8% |
| Interquartile 75% (IQ3) | 3.1% | 3.4% |
| Interquartile Range (IQR) | 1.4% | 1.7% |
| Standard Deviation (Sample) | 1.6% | 1.7% |
| Standard Deviation (Population) | 1.6% | 1.7% |
Similar Demographics by Single Father Households
Demographics Similar to Immigrants from Egypt by Single Father Households
In terms of single father households, the demographic groups most similar to Immigrants from Egypt are Immigrants from Bangladesh (2.1%, a difference of 0.0%), Immigrants from Kuwait (2.1%, a difference of 0.15%), Immigrants from Spain (2.1%, a difference of 0.15%), Egyptian (2.1%, a difference of 0.16%), and Immigrants from Sweden (2.1%, a difference of 0.28%).
| Demographics | Rating | Rank | Single Father Households |
| Immigrants | Italy | 99.8 /100 | #67 | Exceptional 2.1% |
| Immigrants | Denmark | 99.8 /100 | #68 | Exceptional 2.1% |
| Immigrants | Romania | 99.8 /100 | #69 | Exceptional 2.1% |
| Egyptians | 99.8 /100 | #70 | Exceptional 2.1% |
| Immigrants | Kuwait | 99.8 /100 | #71 | Exceptional 2.1% |
| Immigrants | Spain | 99.8 /100 | #72 | Exceptional 2.1% |
| Immigrants | Bangladesh | 99.8 /100 | #73 | Exceptional 2.1% |
| Immigrants | Egypt | 99.8 /100 | #74 | Exceptional 2.1% |
| Immigrants | Sweden | 99.8 /100 | #75 | Exceptional 2.1% |
| Immigrants | Scotland | 99.8 /100 | #76 | Exceptional 2.1% |
| Immigrants | Saudi Arabia | 99.8 /100 | #77 | Exceptional 2.1% |
| Estonians | 99.7 /100 | #78 | Exceptional 2.1% |
| Immigrants | Asia | 99.7 /100 | #79 | Exceptional 2.1% |
| Immigrants | South Africa | 99.7 /100 | #80 | Exceptional 2.1% |
| Armenians | 99.7 /100 | #81 | Exceptional 2.1% |
Demographics Similar to Immigrants from Sudan by Single Father Households
In terms of single father households, the demographic groups most similar to Immigrants from Sudan are Immigrants from Africa (2.4%, a difference of 0.010%), Uruguayan (2.4%, a difference of 0.010%), Panamanian (2.4%, a difference of 0.020%), Immigrants from Philippines (2.4%, a difference of 0.10%), and Kenyan (2.4%, a difference of 0.15%).
| Demographics | Rating | Rank | Single Father Households |
| Nigerians | 41.0 /100 | #185 | Average 2.4% |
| Immigrants | Bosnia and Herzegovina | 40.4 /100 | #186 | Average 2.4% |
| Immigrants | Colombia | 34.0 /100 | #187 | Fair 2.4% |
| Hmong | 33.0 /100 | #188 | Fair 2.4% |
| U.S. Virgin Islanders | 31.8 /100 | #189 | Fair 2.4% |
| French | 31.7 /100 | #190 | Fair 2.4% |
| Immigrants | Africa | 30.0 /100 | #191 | Fair 2.4% |
| Immigrants | Sudan | 29.8 /100 | #192 | Fair 2.4% |
| Uruguayans | 29.7 /100 | #193 | Fair 2.4% |
| Panamanians | 29.6 /100 | #194 | Fair 2.4% |
| Immigrants | Philippines | 28.7 /100 | #195 | Fair 2.4% |
| Kenyans | 28.0 /100 | #196 | Fair 2.4% |
| Germans | 28.0 /100 | #197 | Fair 2.4% |
| Scandinavians | 27.4 /100 | #198 | Fair 2.4% |
| Immigrants | Vietnam | 27.1 /100 | #199 | Fair 2.4% |