Belgian vs Maltese Currently Married
COMPARE
Belgian
Maltese
Currently Married
Currently Married Comparison
Belgians
Maltese
48.7%
CURRENTLY MARRIED
99.3/ 100
METRIC RATING
45th/ 347
METRIC RANK
49.0%
CURRENTLY MARRIED
99.6/ 100
METRIC RATING
25th/ 347
METRIC RANK
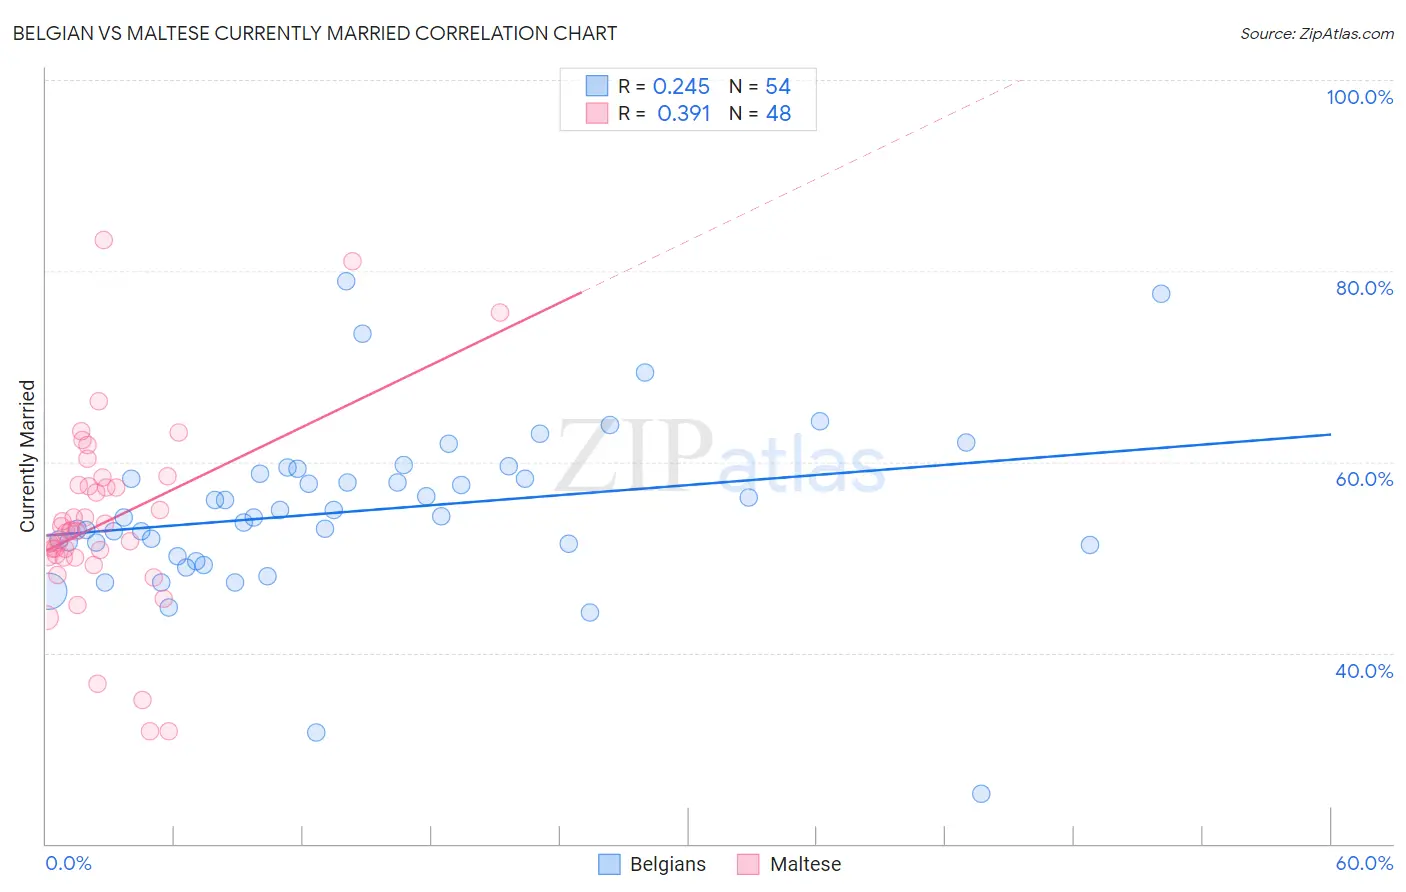
Belgian vs Maltese Currently Married Correlation Chart
The statistical analysis conducted on geographies consisting of 355,993,488 people shows a weak positive correlation between the proportion of Belgians and percentage of population currently married in the United States with a correlation coefficient (R) of 0.245 and weighted average of 48.7%. Similarly, the statistical analysis conducted on geographies consisting of 126,466,050 people shows a mild positive correlation between the proportion of Maltese and percentage of population currently married in the United States with a correlation coefficient (R) of 0.391 and weighted average of 49.0%, a difference of 0.58%.
Currently Married Correlation Summary
| Measurement | Belgian | Maltese |
| Minimum | 25.2% | 31.8% |
| Maximum | 78.9% | 83.3% |
| Range | 53.7% | 51.5% |
| Mean | 54.9% | 53.8% |
| Median | 54.3% | 52.8% |
| Interquartile 25% (IQ1) | 51.3% | 50.0% |
| Interquartile 75% (IQ3) | 58.7% | 57.5% |
| Interquartile Range (IQR) | 7.4% | 7.5% |
| Standard Deviation (Sample) | 9.0% | 10.1% |
| Standard Deviation (Population) | 8.9% | 10.0% |
Demographics Similar to Belgians and Maltese by Currently Married
In terms of currently married, the demographic groups most similar to Belgians are Immigrants from North America (48.7%, a difference of 0.030%), Finnish (48.8%, a difference of 0.060%), Scotch-Irish (48.7%, a difference of 0.060%), Greek (48.8%, a difference of 0.11%), and Immigrants from Canada (48.8%, a difference of 0.13%). Similarly, the demographic groups most similar to Maltese are Immigrants from Korea (49.0%, a difference of 0.050%), Burmese (48.9%, a difference of 0.12%), Welsh (48.9%, a difference of 0.16%), Croatian (48.9%, a difference of 0.21%), and Eastern European (48.9%, a difference of 0.22%).
| Demographics | Rating | Rank | Currently Married |
| Maltese | 99.6 /100 | #25 | Exceptional 49.0% |
| Immigrants | Korea | 99.6 /100 | #26 | Exceptional 49.0% |
| Burmese | 99.6 /100 | #27 | Exceptional 48.9% |
| Welsh | 99.5 /100 | #28 | Exceptional 48.9% |
| Croatians | 99.5 /100 | #29 | Exceptional 48.9% |
| Eastern Europeans | 99.5 /100 | #30 | Exceptional 48.9% |
| Poles | 99.5 /100 | #31 | Exceptional 48.9% |
| Immigrants | Hong Kong | 99.5 /100 | #32 | Exceptional 48.9% |
| Irish | 99.5 /100 | #33 | Exceptional 48.9% |
| Immigrants | Lithuania | 99.4 /100 | #34 | Exceptional 48.8% |
| Immigrants | Northern Europe | 99.4 /100 | #35 | Exceptional 48.8% |
| Italians | 99.4 /100 | #36 | Exceptional 48.8% |
| Hungarians | 99.4 /100 | #37 | Exceptional 48.8% |
| Czechoslovakians | 99.4 /100 | #38 | Exceptional 48.8% |
| British | 99.4 /100 | #39 | Exceptional 48.8% |
| Immigrants | Canada | 99.4 /100 | #40 | Exceptional 48.8% |
| Greeks | 99.3 /100 | #41 | Exceptional 48.8% |
| Finns | 99.3 /100 | #42 | Exceptional 48.8% |
| Scotch-Irish | 99.3 /100 | #43 | Exceptional 48.7% |
| Immigrants | North America | 99.3 /100 | #44 | Exceptional 48.7% |
| Belgians | 99.3 /100 | #45 | Exceptional 48.7% |