Belgian vs Immigrants from the Azores Cognitive Disability
COMPARE
Belgian
Immigrants from the Azores
Cognitive Disability
Cognitive Disability Comparison
Belgians
Immigrants from the Azores
16.7%
COGNITIVE DISABILITY
99.1/ 100
METRIC RATING
84th/ 347
METRIC RANK
17.9%
COGNITIVE DISABILITY
0.6/ 100
METRIC RATING
255th/ 347
METRIC RANK
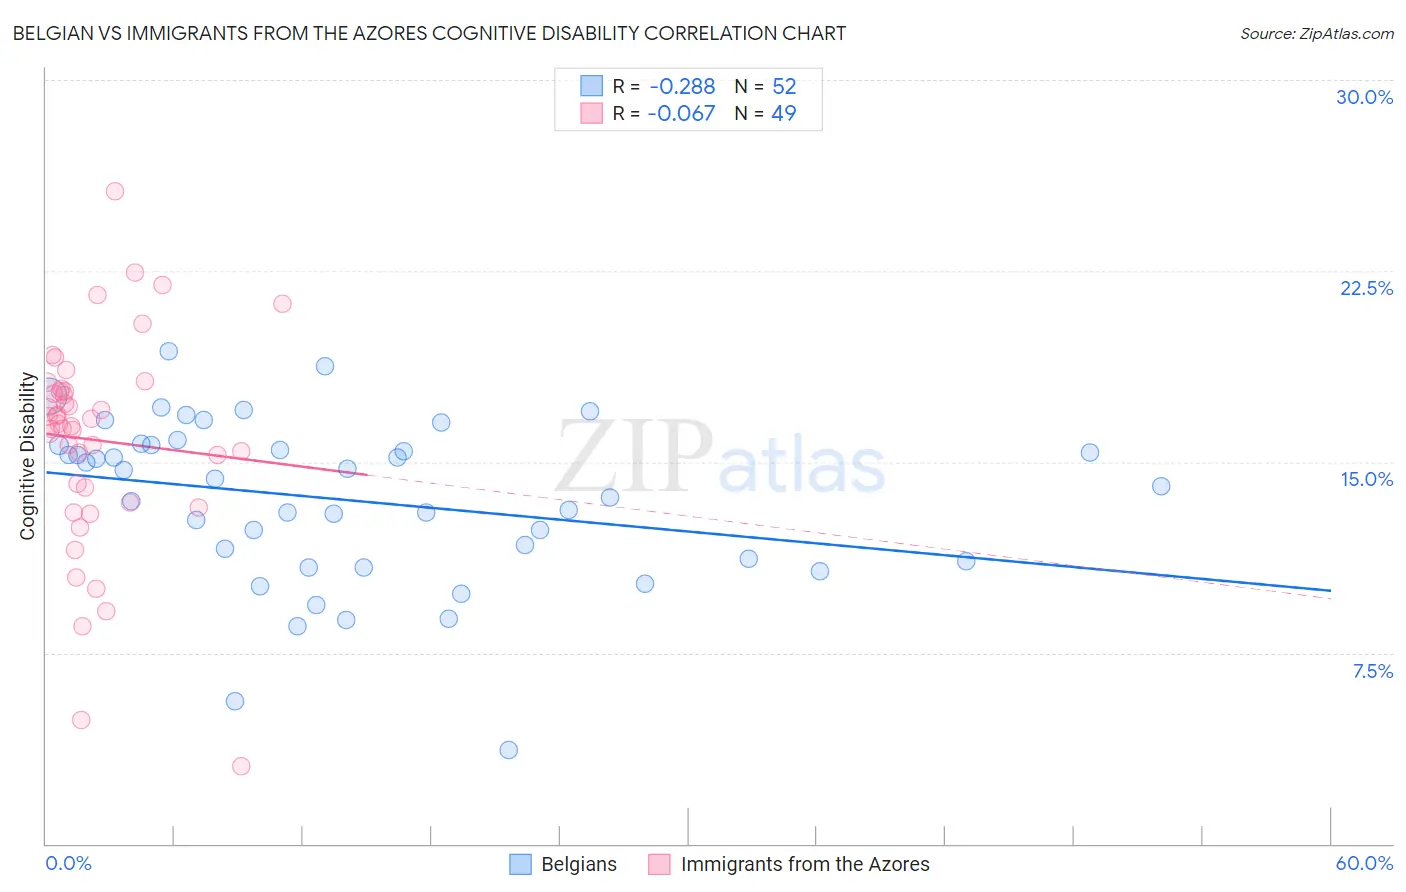
Belgian vs Immigrants from the Azores Cognitive Disability Correlation Chart
The statistical analysis conducted on geographies consisting of 355,993,312 people shows a weak negative correlation between the proportion of Belgians and percentage of population with cognitive disability in the United States with a correlation coefficient (R) of -0.288 and weighted average of 16.7%. Similarly, the statistical analysis conducted on geographies consisting of 46,257,310 people shows a slight negative correlation between the proportion of Immigrants from the Azores and percentage of population with cognitive disability in the United States with a correlation coefficient (R) of -0.067 and weighted average of 17.9%, a difference of 7.2%.
Cognitive Disability Correlation Summary
| Measurement | Belgian | Immigrants from the Azores |
| Minimum | 3.7% | 3.0% |
| Maximum | 19.4% | 25.6% |
| Range | 15.7% | 22.6% |
| Mean | 13.5% | 15.9% |
| Median | 14.2% | 16.5% |
| Interquartile 25% (IQ1) | 11.1% | 13.7% |
| Interquartile 75% (IQ3) | 15.6% | 17.8% |
| Interquartile Range (IQR) | 4.5% | 4.1% |
| Standard Deviation (Sample) | 3.2% | 4.2% |
| Standard Deviation (Population) | 3.2% | 4.1% |
Similar Demographics by Cognitive Disability
Demographics Similar to Belgians by Cognitive Disability
In terms of cognitive disability, the demographic groups most similar to Belgians are Serbian (16.7%, a difference of 0.020%), Immigrants from Moldova (16.7%, a difference of 0.020%), Immigrants from South Africa (16.7%, a difference of 0.050%), Native Hawaiian (16.7%, a difference of 0.060%), and Swiss (16.7%, a difference of 0.090%).
| Demographics | Rating | Rank | Cognitive Disability |
| Immigrants | Hungary | 99.3 /100 | #77 | Exceptional 16.7% |
| Peruvians | 99.3 /100 | #78 | Exceptional 16.7% |
| Immigrants | Bulgaria | 99.3 /100 | #79 | Exceptional 16.7% |
| Egyptians | 99.2 /100 | #80 | Exceptional 16.7% |
| Immigrants | Netherlands | 99.2 /100 | #81 | Exceptional 16.7% |
| Swiss | 99.2 /100 | #82 | Exceptional 16.7% |
| Serbians | 99.1 /100 | #83 | Exceptional 16.7% |
| Belgians | 99.1 /100 | #84 | Exceptional 16.7% |
| Immigrants | Moldova | 99.1 /100 | #85 | Exceptional 16.7% |
| Immigrants | South Africa | 99.0 /100 | #86 | Exceptional 16.7% |
| Native Hawaiians | 99.0 /100 | #87 | Exceptional 16.7% |
| Immigrants | Philippines | 99.0 /100 | #88 | Exceptional 16.7% |
| Immigrants | Egypt | 98.8 /100 | #89 | Exceptional 16.7% |
| South Americans | 98.8 /100 | #90 | Exceptional 16.7% |
| Danes | 98.8 /100 | #91 | Exceptional 16.7% |
Demographics Similar to Immigrants from the Azores by Cognitive Disability
In terms of cognitive disability, the demographic groups most similar to Immigrants from the Azores are Hispanic or Latino (17.9%, a difference of 0.0%), Bahamian (17.9%, a difference of 0.0%), Hopi (17.9%, a difference of 0.010%), Immigrants from Grenada (17.9%, a difference of 0.020%), and Malaysian (17.9%, a difference of 0.030%).
| Demographics | Rating | Rank | Cognitive Disability |
| French American Indians | 0.7 /100 | #248 | Tragic 17.9% |
| Cree | 0.7 /100 | #249 | Tragic 17.9% |
| Immigrants | Ethiopia | 0.7 /100 | #250 | Tragic 17.9% |
| Malaysians | 0.6 /100 | #251 | Tragic 17.9% |
| Immigrants | Grenada | 0.6 /100 | #252 | Tragic 17.9% |
| Hopi | 0.6 /100 | #253 | Tragic 17.9% |
| Hispanics or Latinos | 0.6 /100 | #254 | Tragic 17.9% |
| Immigrants | Azores | 0.6 /100 | #255 | Tragic 17.9% |
| Bahamians | 0.6 /100 | #256 | Tragic 17.9% |
| Mexican American Indians | 0.6 /100 | #257 | Tragic 17.9% |
| Immigrants | Armenia | 0.6 /100 | #258 | Tragic 17.9% |
| Ethiopians | 0.5 /100 | #259 | Tragic 17.9% |
| Immigrants | Belize | 0.5 /100 | #260 | Tragic 17.9% |
| Guamanians/Chamorros | 0.5 /100 | #261 | Tragic 17.9% |
| Sierra Leoneans | 0.4 /100 | #262 | Tragic 17.9% |