Belgian vs Guyanese Currently Married
COMPARE
Belgian
Guyanese
Currently Married
Currently Married Comparison
Belgians
Guyanese
48.7%
CURRENTLY MARRIED
99.3/ 100
METRIC RATING
45th/ 347
METRIC RANK
41.6%
CURRENTLY MARRIED
0.0/ 100
METRIC RATING
310th/ 347
METRIC RANK
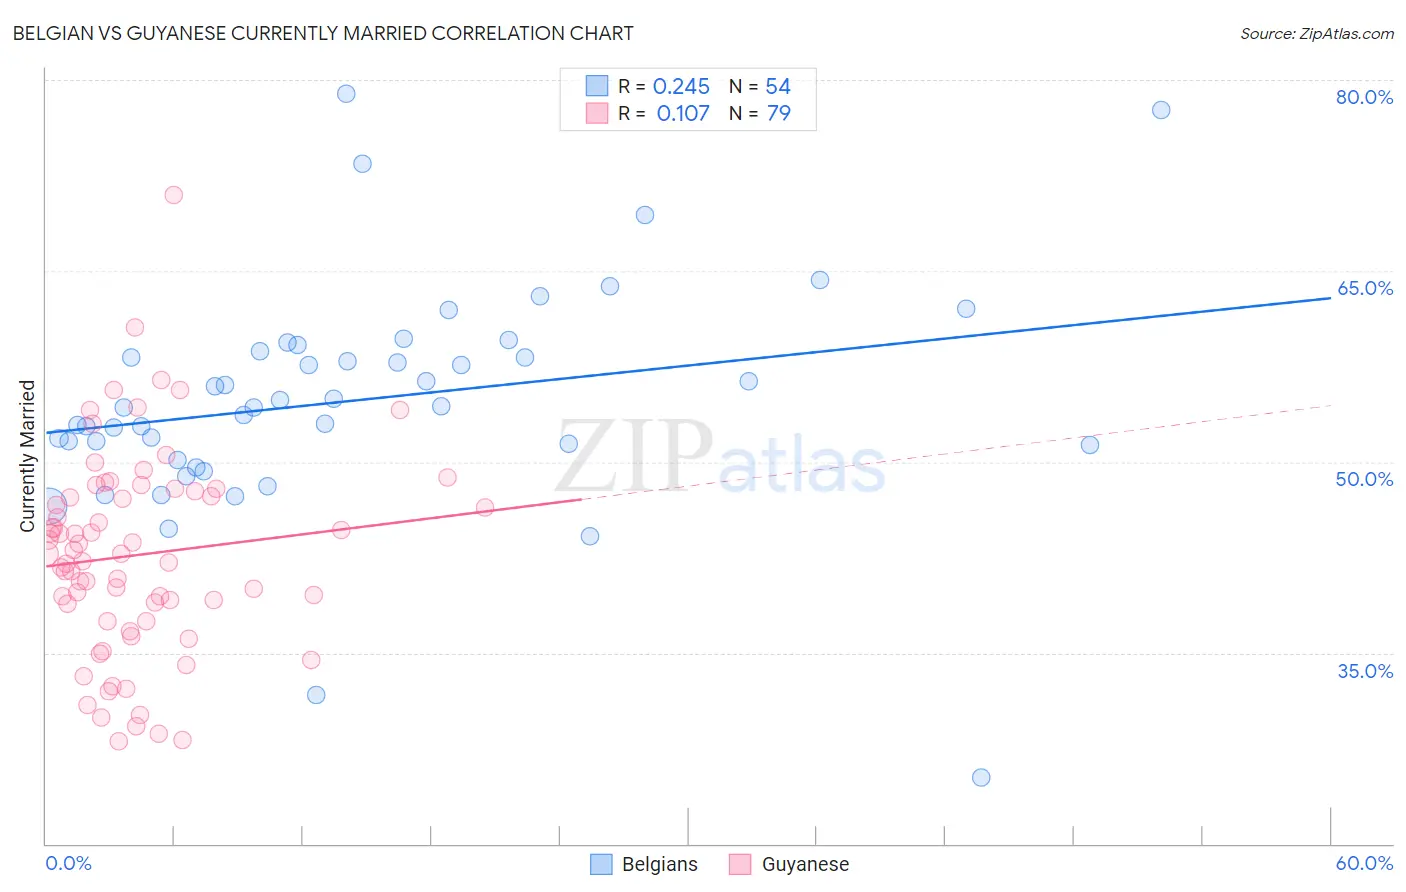
Belgian vs Guyanese Currently Married Correlation Chart
The statistical analysis conducted on geographies consisting of 355,993,488 people shows a weak positive correlation between the proportion of Belgians and percentage of population currently married in the United States with a correlation coefficient (R) of 0.245 and weighted average of 48.7%. Similarly, the statistical analysis conducted on geographies consisting of 176,911,764 people shows a poor positive correlation between the proportion of Guyanese and percentage of population currently married in the United States with a correlation coefficient (R) of 0.107 and weighted average of 41.6%, a difference of 17.1%.
Currently Married Correlation Summary
| Measurement | Belgian | Guyanese |
| Minimum | 25.2% | 28.1% |
| Maximum | 78.9% | 71.0% |
| Range | 53.7% | 42.9% |
| Mean | 54.9% | 42.7% |
| Median | 54.3% | 42.8% |
| Interquartile 25% (IQ1) | 51.3% | 37.5% |
| Interquartile 75% (IQ3) | 58.7% | 47.7% |
| Interquartile Range (IQR) | 7.4% | 10.2% |
| Standard Deviation (Sample) | 9.0% | 7.9% |
| Standard Deviation (Population) | 8.9% | 7.9% |
Similar Demographics by Currently Married
Demographics Similar to Belgians by Currently Married
In terms of currently married, the demographic groups most similar to Belgians are Immigrants from North America (48.7%, a difference of 0.030%), Immigrants from Iran (48.7%, a difference of 0.030%), Northern European (48.7%, a difference of 0.040%), Austrian (48.7%, a difference of 0.050%), and Finnish (48.8%, a difference of 0.060%).
| Demographics | Rating | Rank | Currently Married |
| Czechoslovakians | 99.4 /100 | #38 | Exceptional 48.8% |
| British | 99.4 /100 | #39 | Exceptional 48.8% |
| Immigrants | Canada | 99.4 /100 | #40 | Exceptional 48.8% |
| Greeks | 99.3 /100 | #41 | Exceptional 48.8% |
| Finns | 99.3 /100 | #42 | Exceptional 48.8% |
| Scotch-Irish | 99.3 /100 | #43 | Exceptional 48.7% |
| Immigrants | North America | 99.3 /100 | #44 | Exceptional 48.7% |
| Belgians | 99.3 /100 | #45 | Exceptional 48.7% |
| Immigrants | Iran | 99.2 /100 | #46 | Exceptional 48.7% |
| Northern Europeans | 99.2 /100 | #47 | Exceptional 48.7% |
| Austrians | 99.2 /100 | #48 | Exceptional 48.7% |
| Bhutanese | 99.1 /100 | #49 | Exceptional 48.6% |
| Iranians | 99.0 /100 | #50 | Exceptional 48.6% |
| Whites/Caucasians | 99.0 /100 | #51 | Exceptional 48.6% |
| Russians | 98.9 /100 | #52 | Exceptional 48.6% |
Demographics Similar to Guyanese by Currently Married
In terms of currently married, the demographic groups most similar to Guyanese are Trinidadian and Tobagonian (41.5%, a difference of 0.15%), Somali (41.5%, a difference of 0.33%), Immigrants from Liberia (41.8%, a difference of 0.36%), Immigrants from Belize (41.8%, a difference of 0.48%), and African (41.8%, a difference of 0.52%).
| Demographics | Rating | Rank | Currently Married |
| Sioux | 0.0 /100 | #303 | Tragic 41.9% |
| Immigrants | Bahamas | 0.0 /100 | #304 | Tragic 41.9% |
| Immigrants | Trinidad and Tobago | 0.0 /100 | #305 | Tragic 41.9% |
| Immigrants | Guyana | 0.0 /100 | #306 | Tragic 41.9% |
| Africans | 0.0 /100 | #307 | Tragic 41.8% |
| Immigrants | Belize | 0.0 /100 | #308 | Tragic 41.8% |
| Immigrants | Liberia | 0.0 /100 | #309 | Tragic 41.8% |
| Guyanese | 0.0 /100 | #310 | Tragic 41.6% |
| Trinidadians and Tobagonians | 0.0 /100 | #311 | Tragic 41.5% |
| Somalis | 0.0 /100 | #312 | Tragic 41.5% |
| Jamaicans | 0.0 /100 | #313 | Tragic 41.4% |
| West Indians | 0.0 /100 | #314 | Tragic 41.3% |
| Inupiat | 0.0 /100 | #315 | Tragic 41.3% |
| Immigrants | Caribbean | 0.0 /100 | #316 | Tragic 41.3% |
| Haitians | 0.0 /100 | #317 | Tragic 41.3% |