Belgian vs Immigrants from England Currently Married
COMPARE
Belgian
Immigrants from England
Currently Married
Currently Married Comparison
Belgians
Immigrants from England
48.7%
CURRENTLY MARRIED
99.3/ 100
METRIC RATING
45th/ 347
METRIC RANK
48.3%
CURRENTLY MARRIED
98.2/ 100
METRIC RATING
68th/ 347
METRIC RANK
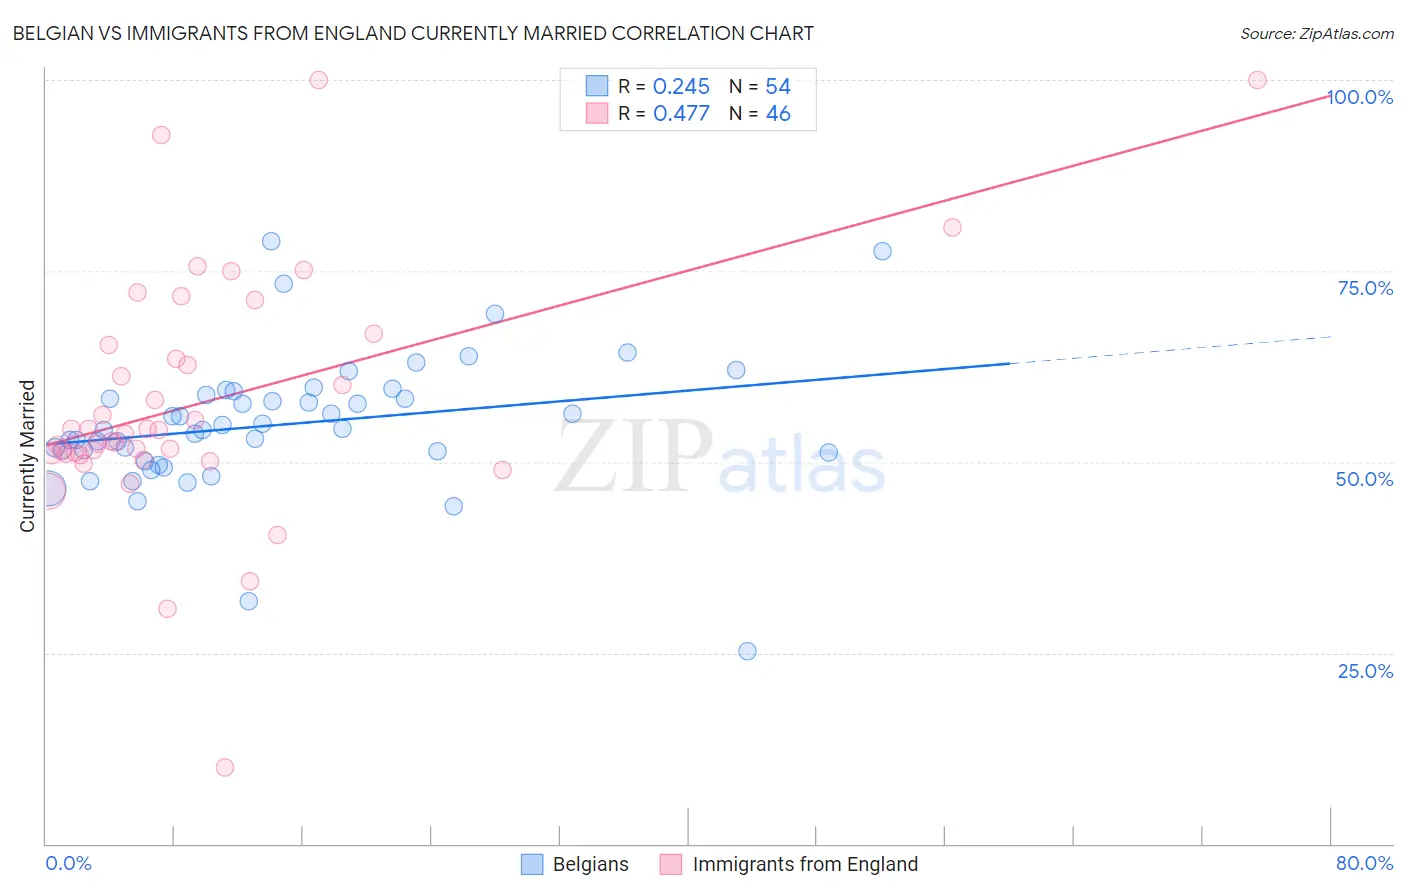
Belgian vs Immigrants from England Currently Married Correlation Chart
The statistical analysis conducted on geographies consisting of 355,993,488 people shows a weak positive correlation between the proportion of Belgians and percentage of population currently married in the United States with a correlation coefficient (R) of 0.245 and weighted average of 48.7%. Similarly, the statistical analysis conducted on geographies consisting of 391,864,919 people shows a moderate positive correlation between the proportion of Immigrants from England and percentage of population currently married in the United States with a correlation coefficient (R) of 0.477 and weighted average of 48.3%, a difference of 0.81%.
Currently Married Correlation Summary
| Measurement | Belgian | Immigrants from England |
| Minimum | 25.2% | 10.0% |
| Maximum | 78.9% | 100.0% |
| Range | 53.7% | 90.0% |
| Mean | 54.9% | 57.9% |
| Median | 54.3% | 54.0% |
| Interquartile 25% (IQ1) | 51.3% | 51.0% |
| Interquartile 75% (IQ3) | 58.7% | 65.3% |
| Interquartile Range (IQR) | 7.4% | 14.3% |
| Standard Deviation (Sample) | 9.0% | 16.3% |
| Standard Deviation (Population) | 8.9% | 16.1% |
Similar Demographics by Currently Married
Demographics Similar to Belgians by Currently Married
In terms of currently married, the demographic groups most similar to Belgians are Immigrants from North America (48.7%, a difference of 0.030%), Immigrants from Iran (48.7%, a difference of 0.030%), Northern European (48.7%, a difference of 0.040%), Austrian (48.7%, a difference of 0.050%), and Finnish (48.8%, a difference of 0.060%).
| Demographics | Rating | Rank | Currently Married |
| Czechoslovakians | 99.4 /100 | #38 | Exceptional 48.8% |
| British | 99.4 /100 | #39 | Exceptional 48.8% |
| Immigrants | Canada | 99.4 /100 | #40 | Exceptional 48.8% |
| Greeks | 99.3 /100 | #41 | Exceptional 48.8% |
| Finns | 99.3 /100 | #42 | Exceptional 48.8% |
| Scotch-Irish | 99.3 /100 | #43 | Exceptional 48.7% |
| Immigrants | North America | 99.3 /100 | #44 | Exceptional 48.7% |
| Belgians | 99.3 /100 | #45 | Exceptional 48.7% |
| Immigrants | Iran | 99.2 /100 | #46 | Exceptional 48.7% |
| Northern Europeans | 99.2 /100 | #47 | Exceptional 48.7% |
| Austrians | 99.2 /100 | #48 | Exceptional 48.7% |
| Bhutanese | 99.1 /100 | #49 | Exceptional 48.6% |
| Iranians | 99.0 /100 | #50 | Exceptional 48.6% |
| Whites/Caucasians | 99.0 /100 | #51 | Exceptional 48.6% |
| Russians | 98.9 /100 | #52 | Exceptional 48.6% |
Demographics Similar to Immigrants from England by Currently Married
In terms of currently married, the demographic groups most similar to Immigrants from England are Slovak (48.3%, a difference of 0.010%), Tongan (48.3%, a difference of 0.020%), Canadian (48.3%, a difference of 0.020%), Ukrainian (48.4%, a difference of 0.050%), and Slavic (48.4%, a difference of 0.060%).
| Demographics | Rating | Rank | Currently Married |
| Romanians | 98.5 /100 | #61 | Exceptional 48.4% |
| Asians | 98.5 /100 | #62 | Exceptional 48.4% |
| Slavs | 98.3 /100 | #63 | Exceptional 48.4% |
| Immigrants | Czechoslovakia | 98.3 /100 | #64 | Exceptional 48.4% |
| Ukrainians | 98.3 /100 | #65 | Exceptional 48.4% |
| Tongans | 98.2 /100 | #66 | Exceptional 48.3% |
| Slovaks | 98.2 /100 | #67 | Exceptional 48.3% |
| Immigrants | England | 98.2 /100 | #68 | Exceptional 48.3% |
| Canadians | 98.1 /100 | #69 | Exceptional 48.3% |
| Immigrants | Asia | 97.9 /100 | #70 | Exceptional 48.3% |
| Macedonians | 97.9 /100 | #71 | Exceptional 48.3% |
| Immigrants | Lebanon | 97.6 /100 | #72 | Exceptional 48.2% |
| Immigrants | Eastern Asia | 97.5 /100 | #73 | Exceptional 48.2% |
| Estonians | 97.4 /100 | #74 | Exceptional 48.2% |
| Immigrants | Belarus | 97.2 /100 | #75 | Exceptional 48.1% |