Basque vs Immigrants from Zimbabwe Currently Married
COMPARE
Basque
Immigrants from Zimbabwe
Currently Married
Currently Married Comparison
Basques
Immigrants from Zimbabwe
48.1%
CURRENTLY MARRIED
97.2/ 100
METRIC RATING
76th/ 347
METRIC RANK
46.7%
CURRENTLY MARRIED
52.4/ 100
METRIC RATING
171st/ 347
METRIC RANK
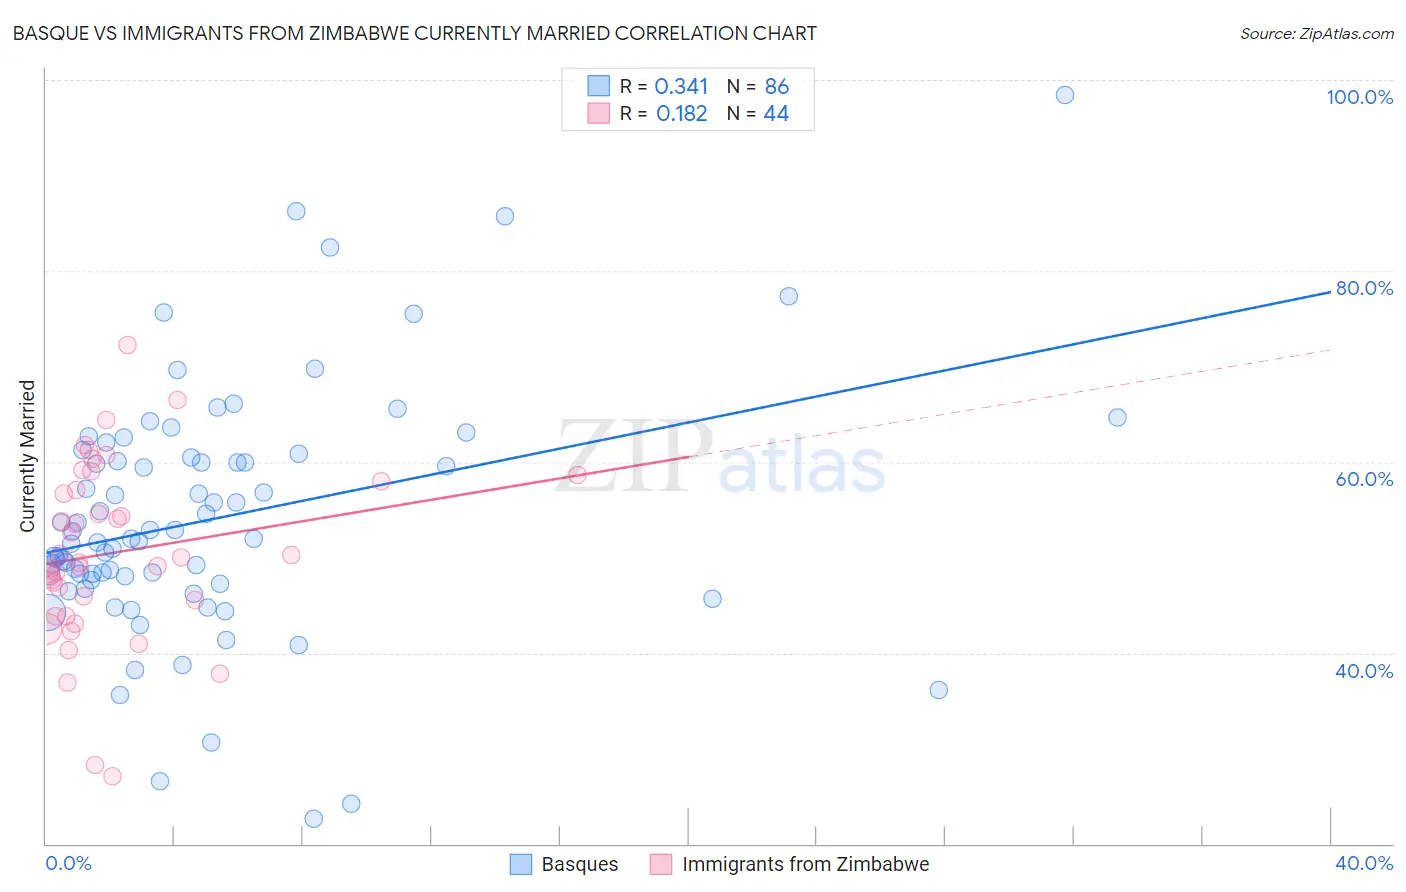
Basque vs Immigrants from Zimbabwe Currently Married Correlation Chart
The statistical analysis conducted on geographies consisting of 165,765,037 people shows a mild positive correlation between the proportion of Basques and percentage of population currently married in the United States with a correlation coefficient (R) of 0.341 and weighted average of 48.1%. Similarly, the statistical analysis conducted on geographies consisting of 117,813,548 people shows a poor positive correlation between the proportion of Immigrants from Zimbabwe and percentage of population currently married in the United States with a correlation coefficient (R) of 0.182 and weighted average of 46.7%, a difference of 3.1%.
Currently Married Correlation Summary
| Measurement | Basque | Immigrants from Zimbabwe |
| Minimum | 22.6% | 27.1% |
| Maximum | 98.4% | 72.3% |
| Range | 75.8% | 45.2% |
| Mean | 54.1% | 50.5% |
| Median | 52.0% | 49.7% |
| Interquartile 25% (IQ1) | 47.6% | 44.7% |
| Interquartile 75% (IQ3) | 60.5% | 57.6% |
| Interquartile Range (IQR) | 12.9% | 12.9% |
| Standard Deviation (Sample) | 12.9% | 9.3% |
| Standard Deviation (Population) | 12.9% | 9.2% |
Similar Demographics by Currently Married
Demographics Similar to Basques by Currently Married
In terms of currently married, the demographic groups most similar to Basques are Immigrants from Belarus (48.1%, a difference of 0.020%), Slovene (48.1%, a difference of 0.020%), Immigrants from Belgium (48.1%, a difference of 0.030%), Immigrants from South Africa (48.1%, a difference of 0.040%), and Immigrants from Poland (48.1%, a difference of 0.080%).
| Demographics | Rating | Rank | Currently Married |
| Canadians | 98.1 /100 | #69 | Exceptional 48.3% |
| Immigrants | Asia | 97.9 /100 | #70 | Exceptional 48.3% |
| Macedonians | 97.9 /100 | #71 | Exceptional 48.3% |
| Immigrants | Lebanon | 97.6 /100 | #72 | Exceptional 48.2% |
| Immigrants | Eastern Asia | 97.5 /100 | #73 | Exceptional 48.2% |
| Estonians | 97.4 /100 | #74 | Exceptional 48.2% |
| Immigrants | Belarus | 97.2 /100 | #75 | Exceptional 48.1% |
| Basques | 97.2 /100 | #76 | Exceptional 48.1% |
| Slovenes | 97.1 /100 | #77 | Exceptional 48.1% |
| Immigrants | Belgium | 97.1 /100 | #78 | Exceptional 48.1% |
| Immigrants | South Africa | 97.0 /100 | #79 | Exceptional 48.1% |
| Immigrants | Poland | 96.9 /100 | #80 | Exceptional 48.1% |
| Immigrants | Sri Lanka | 96.9 /100 | #81 | Exceptional 48.1% |
| Immigrants | Europe | 96.9 /100 | #82 | Exceptional 48.1% |
| Bolivians | 96.9 /100 | #83 | Exceptional 48.1% |
Demographics Similar to Immigrants from Zimbabwe by Currently Married
In terms of currently married, the demographic groups most similar to Immigrants from Zimbabwe are Aleut (46.7%, a difference of 0.010%), Tlingit-Haida (46.7%, a difference of 0.050%), Peruvian (46.6%, a difference of 0.090%), Immigrants from Brazil (46.6%, a difference of 0.090%), and Hawaiian (46.6%, a difference of 0.14%).
| Demographics | Rating | Rank | Currently Married |
| Immigrants | Western Asia | 64.2 /100 | #164 | Good 46.9% |
| Samoans | 59.8 /100 | #165 | Average 46.8% |
| Immigrants | Syria | 59.3 /100 | #166 | Average 46.8% |
| Spaniards | 58.8 /100 | #167 | Average 46.8% |
| Immigrants | Afghanistan | 58.2 /100 | #168 | Average 46.8% |
| Armenians | 58.2 /100 | #169 | Average 46.8% |
| Immigrants | Latvia | 56.7 /100 | #170 | Average 46.7% |
| Immigrants | Zimbabwe | 52.4 /100 | #171 | Average 46.7% |
| Aleuts | 52.0 /100 | #172 | Average 46.7% |
| Tlingit-Haida | 51.2 /100 | #173 | Average 46.7% |
| Peruvians | 50.0 /100 | #174 | Average 46.6% |
| Immigrants | Brazil | 49.9 /100 | #175 | Average 46.6% |
| Hawaiians | 48.6 /100 | #176 | Average 46.6% |
| Israelis | 48.6 /100 | #177 | Average 46.6% |
| Chickasaw | 47.8 /100 | #178 | Average 46.6% |