Basque vs Immigrants from Yemen Currently Married
COMPARE
Basque
Immigrants from Yemen
Currently Married
Currently Married Comparison
Basques
Immigrants from Yemen
48.1%
CURRENTLY MARRIED
97.2/ 100
METRIC RATING
76th/ 347
METRIC RANK
42.1%
CURRENTLY MARRIED
0.0/ 100
METRIC RATING
301st/ 347
METRIC RANK
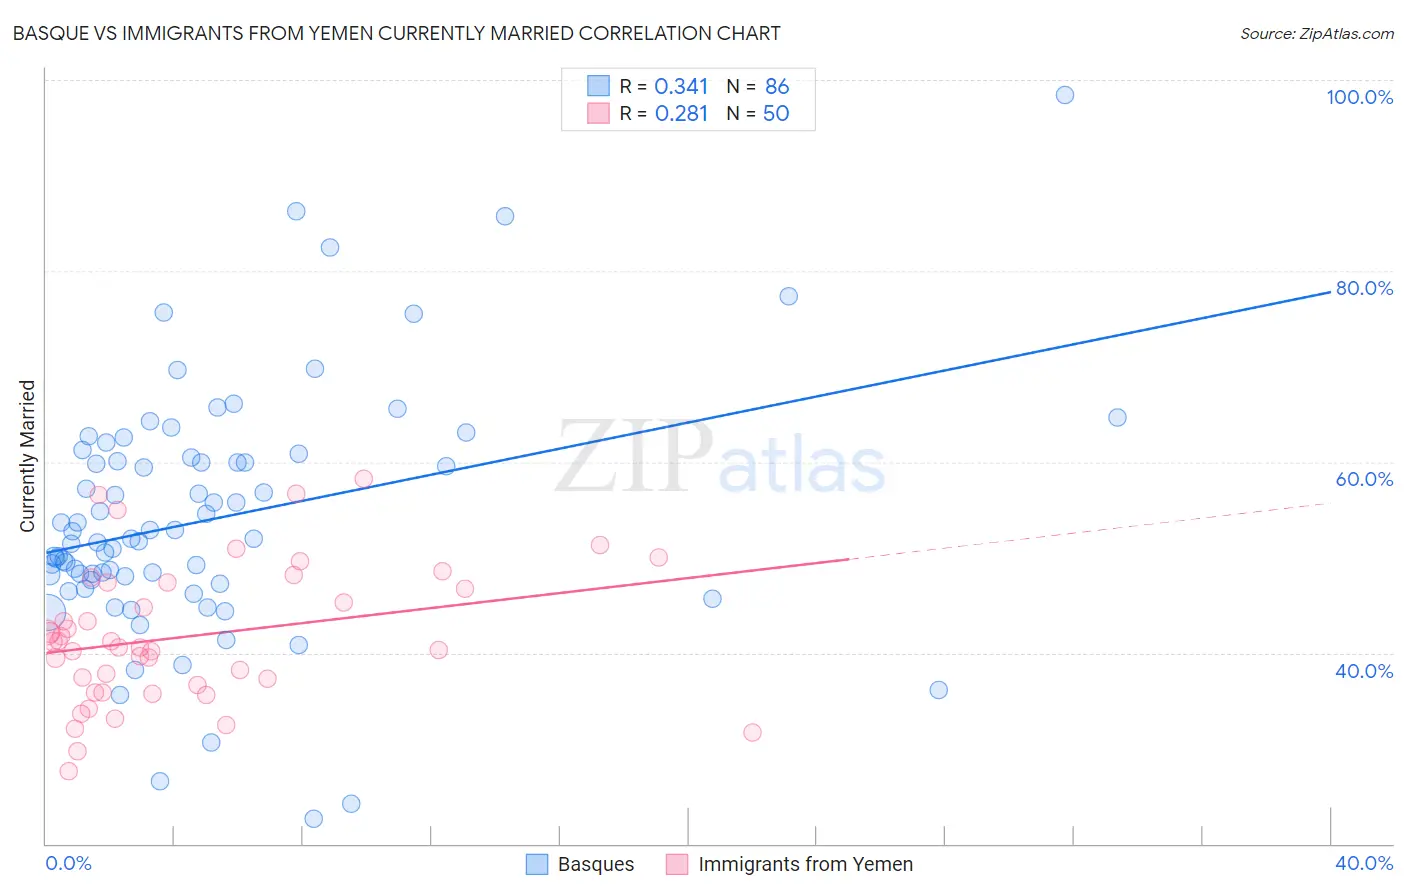
Basque vs Immigrants from Yemen Currently Married Correlation Chart
The statistical analysis conducted on geographies consisting of 165,765,037 people shows a mild positive correlation between the proportion of Basques and percentage of population currently married in the United States with a correlation coefficient (R) of 0.341 and weighted average of 48.1%. Similarly, the statistical analysis conducted on geographies consisting of 82,431,124 people shows a weak positive correlation between the proportion of Immigrants from Yemen and percentage of population currently married in the United States with a correlation coefficient (R) of 0.281 and weighted average of 42.1%, a difference of 14.5%.
Currently Married Correlation Summary
| Measurement | Basque | Immigrants from Yemen |
| Minimum | 22.6% | 27.6% |
| Maximum | 98.4% | 58.2% |
| Range | 75.8% | 30.6% |
| Mean | 54.1% | 41.7% |
| Median | 52.0% | 40.8% |
| Interquartile 25% (IQ1) | 47.6% | 36.6% |
| Interquartile 75% (IQ3) | 60.5% | 47.3% |
| Interquartile Range (IQR) | 12.9% | 10.7% |
| Standard Deviation (Sample) | 12.9% | 7.2% |
| Standard Deviation (Population) | 12.9% | 7.1% |
Similar Demographics by Currently Married
Demographics Similar to Basques by Currently Married
In terms of currently married, the demographic groups most similar to Basques are Immigrants from Belarus (48.1%, a difference of 0.020%), Slovene (48.1%, a difference of 0.020%), Immigrants from Belgium (48.1%, a difference of 0.030%), Immigrants from South Africa (48.1%, a difference of 0.040%), and Immigrants from Poland (48.1%, a difference of 0.080%).
| Demographics | Rating | Rank | Currently Married |
| Canadians | 98.1 /100 | #69 | Exceptional 48.3% |
| Immigrants | Asia | 97.9 /100 | #70 | Exceptional 48.3% |
| Macedonians | 97.9 /100 | #71 | Exceptional 48.3% |
| Immigrants | Lebanon | 97.6 /100 | #72 | Exceptional 48.2% |
| Immigrants | Eastern Asia | 97.5 /100 | #73 | Exceptional 48.2% |
| Estonians | 97.4 /100 | #74 | Exceptional 48.2% |
| Immigrants | Belarus | 97.2 /100 | #75 | Exceptional 48.1% |
| Basques | 97.2 /100 | #76 | Exceptional 48.1% |
| Slovenes | 97.1 /100 | #77 | Exceptional 48.1% |
| Immigrants | Belgium | 97.1 /100 | #78 | Exceptional 48.1% |
| Immigrants | South Africa | 97.0 /100 | #79 | Exceptional 48.1% |
| Immigrants | Poland | 96.9 /100 | #80 | Exceptional 48.1% |
| Immigrants | Sri Lanka | 96.9 /100 | #81 | Exceptional 48.1% |
| Immigrants | Europe | 96.9 /100 | #82 | Exceptional 48.1% |
| Bolivians | 96.9 /100 | #83 | Exceptional 48.1% |
Demographics Similar to Immigrants from Yemen by Currently Married
In terms of currently married, the demographic groups most similar to Immigrants from Yemen are Belizean (42.2%, a difference of 0.24%), Immigrants from Zaire (42.0%, a difference of 0.25%), Sioux (41.9%, a difference of 0.26%), Liberian (42.2%, a difference of 0.34%), and Immigrants from Honduras (42.2%, a difference of 0.37%).
| Demographics | Rating | Rank | Currently Married |
| Hondurans | 0.0 /100 | #294 | Tragic 42.5% |
| Immigrants | Western Africa | 0.0 /100 | #295 | Tragic 42.4% |
| Menominee | 0.0 /100 | #296 | Tragic 42.3% |
| Cheyenne | 0.0 /100 | #297 | Tragic 42.2% |
| Immigrants | Honduras | 0.0 /100 | #298 | Tragic 42.2% |
| Liberians | 0.0 /100 | #299 | Tragic 42.2% |
| Belizeans | 0.0 /100 | #300 | Tragic 42.2% |
| Immigrants | Yemen | 0.0 /100 | #301 | Tragic 42.1% |
| Immigrants | Zaire | 0.0 /100 | #302 | Tragic 42.0% |
| Sioux | 0.0 /100 | #303 | Tragic 41.9% |
| Immigrants | Bahamas | 0.0 /100 | #304 | Tragic 41.9% |
| Immigrants | Trinidad and Tobago | 0.0 /100 | #305 | Tragic 41.9% |
| Immigrants | Guyana | 0.0 /100 | #306 | Tragic 41.9% |
| Africans | 0.0 /100 | #307 | Tragic 41.8% |
| Immigrants | Belize | 0.0 /100 | #308 | Tragic 41.8% |