Basque vs Iranian Currently Married
COMPARE
Basque
Iranian
Currently Married
Currently Married Comparison
Basques
Iranians
48.1%
CURRENTLY MARRIED
97.2/ 100
METRIC RATING
76th/ 347
METRIC RANK
48.6%
CURRENTLY MARRIED
99.0/ 100
METRIC RATING
50th/ 347
METRIC RANK
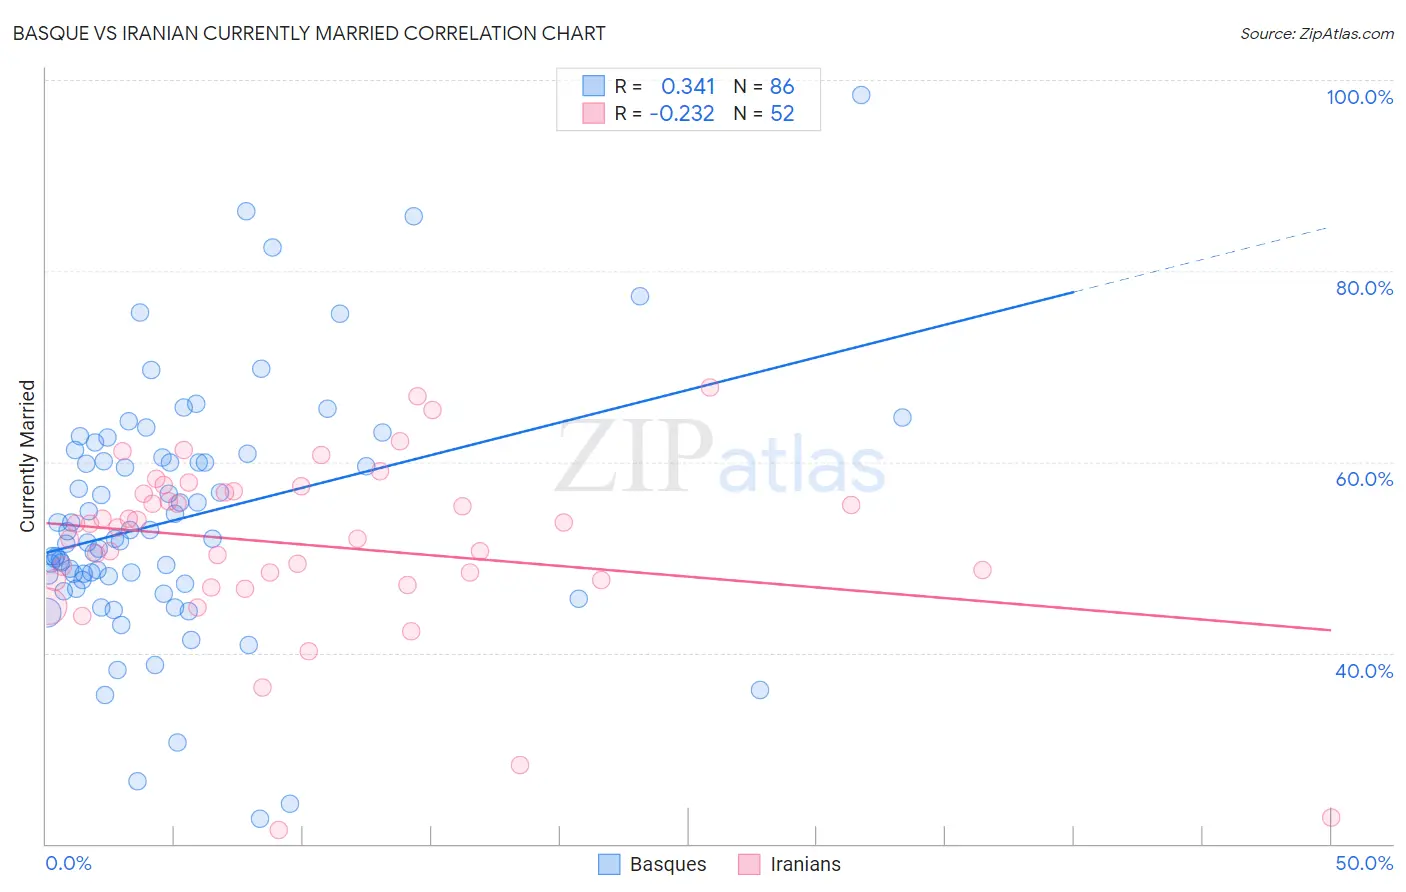
Basque vs Iranian Currently Married Correlation Chart
The statistical analysis conducted on geographies consisting of 165,765,037 people shows a mild positive correlation between the proportion of Basques and percentage of population currently married in the United States with a correlation coefficient (R) of 0.341 and weighted average of 48.1%. Similarly, the statistical analysis conducted on geographies consisting of 316,855,418 people shows a weak negative correlation between the proportion of Iranians and percentage of population currently married in the United States with a correlation coefficient (R) of -0.232 and weighted average of 48.6%, a difference of 0.97%.
Currently Married Correlation Summary
| Measurement | Basque | Iranian |
| Minimum | 22.6% | 21.4% |
| Maximum | 98.4% | 67.8% |
| Range | 75.8% | 46.4% |
| Mean | 54.1% | 51.3% |
| Median | 52.0% | 53.3% |
| Interquartile 25% (IQ1) | 47.6% | 47.6% |
| Interquartile 75% (IQ3) | 60.5% | 56.9% |
| Interquartile Range (IQR) | 12.9% | 9.3% |
| Standard Deviation (Sample) | 12.9% | 9.4% |
| Standard Deviation (Population) | 12.9% | 9.3% |
Similar Demographics by Currently Married
Demographics Similar to Basques by Currently Married
In terms of currently married, the demographic groups most similar to Basques are Immigrants from Belarus (48.1%, a difference of 0.020%), Slovene (48.1%, a difference of 0.020%), Immigrants from Belgium (48.1%, a difference of 0.030%), Immigrants from South Africa (48.1%, a difference of 0.040%), and Immigrants from Poland (48.1%, a difference of 0.080%).
| Demographics | Rating | Rank | Currently Married |
| Canadians | 98.1 /100 | #69 | Exceptional 48.3% |
| Immigrants | Asia | 97.9 /100 | #70 | Exceptional 48.3% |
| Macedonians | 97.9 /100 | #71 | Exceptional 48.3% |
| Immigrants | Lebanon | 97.6 /100 | #72 | Exceptional 48.2% |
| Immigrants | Eastern Asia | 97.5 /100 | #73 | Exceptional 48.2% |
| Estonians | 97.4 /100 | #74 | Exceptional 48.2% |
| Immigrants | Belarus | 97.2 /100 | #75 | Exceptional 48.1% |
| Basques | 97.2 /100 | #76 | Exceptional 48.1% |
| Slovenes | 97.1 /100 | #77 | Exceptional 48.1% |
| Immigrants | Belgium | 97.1 /100 | #78 | Exceptional 48.1% |
| Immigrants | South Africa | 97.0 /100 | #79 | Exceptional 48.1% |
| Immigrants | Poland | 96.9 /100 | #80 | Exceptional 48.1% |
| Immigrants | Sri Lanka | 96.9 /100 | #81 | Exceptional 48.1% |
| Immigrants | Europe | 96.9 /100 | #82 | Exceptional 48.1% |
| Bolivians | 96.9 /100 | #83 | Exceptional 48.1% |
Demographics Similar to Iranians by Currently Married
In terms of currently married, the demographic groups most similar to Iranians are White/Caucasian (48.6%, a difference of 0.010%), Bhutanese (48.6%, a difference of 0.060%), Russian (48.6%, a difference of 0.090%), Austrian (48.7%, a difference of 0.19%), and Immigrants from Iran (48.7%, a difference of 0.21%).
| Demographics | Rating | Rank | Currently Married |
| Scotch-Irish | 99.3 /100 | #43 | Exceptional 48.7% |
| Immigrants | North America | 99.3 /100 | #44 | Exceptional 48.7% |
| Belgians | 99.3 /100 | #45 | Exceptional 48.7% |
| Immigrants | Iran | 99.2 /100 | #46 | Exceptional 48.7% |
| Northern Europeans | 99.2 /100 | #47 | Exceptional 48.7% |
| Austrians | 99.2 /100 | #48 | Exceptional 48.7% |
| Bhutanese | 99.1 /100 | #49 | Exceptional 48.6% |
| Iranians | 99.0 /100 | #50 | Exceptional 48.6% |
| Whites/Caucasians | 99.0 /100 | #51 | Exceptional 48.6% |
| Russians | 98.9 /100 | #52 | Exceptional 48.6% |
| Immigrants | Austria | 98.8 /100 | #53 | Exceptional 48.5% |
| Immigrants | Moldova | 98.7 /100 | #54 | Exceptional 48.5% |
| Immigrants | North Macedonia | 98.7 /100 | #55 | Exceptional 48.5% |
| Latvians | 98.7 /100 | #56 | Exceptional 48.5% |
| Immigrants | Netherlands | 98.6 /100 | #57 | Exceptional 48.5% |