Basque vs Guamanian/Chamorro Currently Married
COMPARE
Basque
Guamanian/Chamorro
Currently Married
Currently Married Comparison
Basques
Guamanians/Chamorros
48.1%
CURRENTLY MARRIED
97.2/ 100
METRIC RATING
76th/ 347
METRIC RANK
47.1%
CURRENTLY MARRIED
74.2/ 100
METRIC RATING
143rd/ 347
METRIC RANK
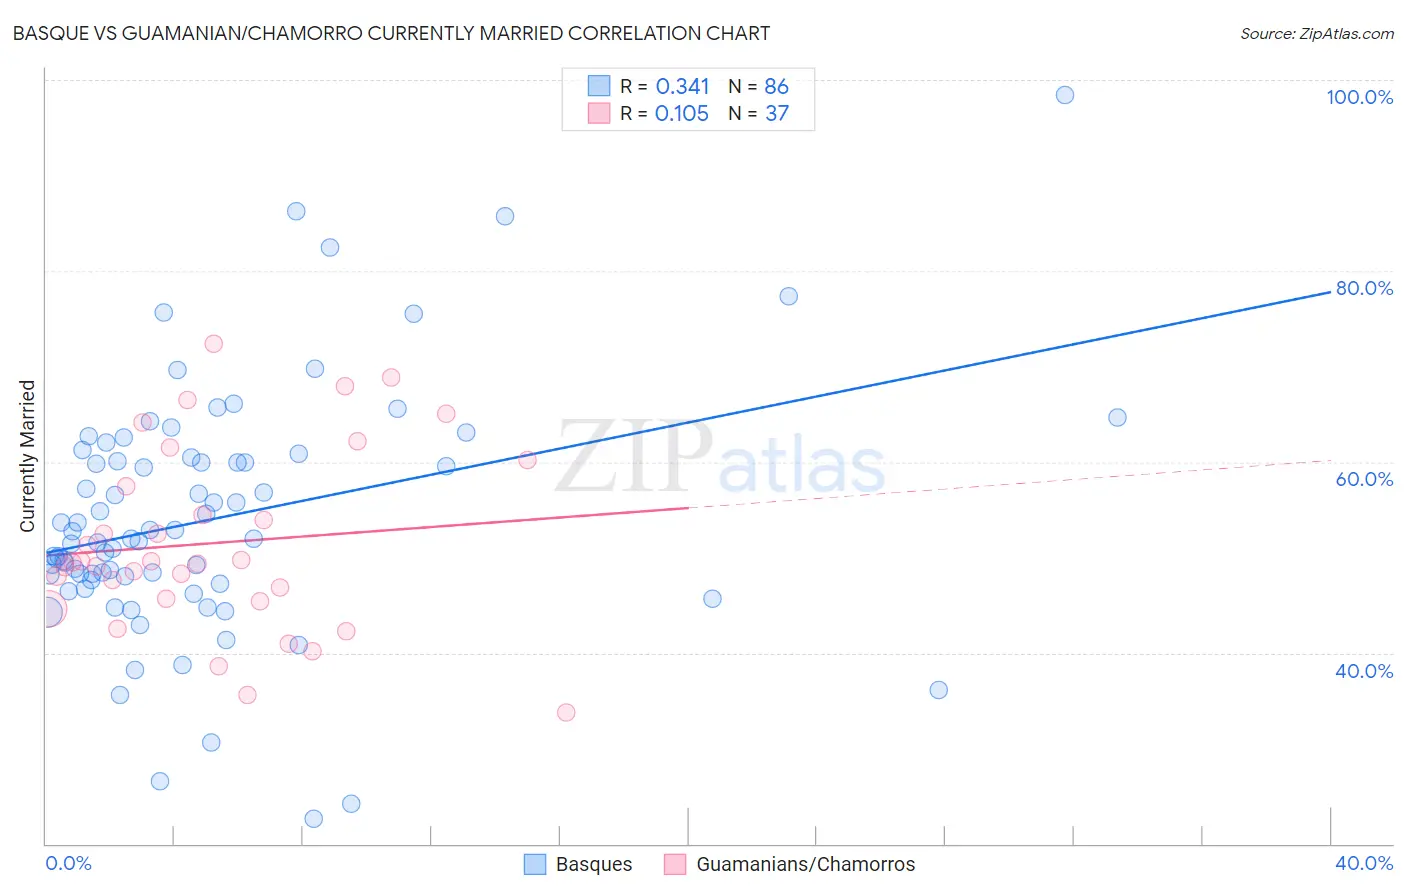
Basque vs Guamanian/Chamorro Currently Married Correlation Chart
The statistical analysis conducted on geographies consisting of 165,765,037 people shows a mild positive correlation between the proportion of Basques and percentage of population currently married in the United States with a correlation coefficient (R) of 0.341 and weighted average of 48.1%. Similarly, the statistical analysis conducted on geographies consisting of 221,951,395 people shows a poor positive correlation between the proportion of Guamanians/Chamorros and percentage of population currently married in the United States with a correlation coefficient (R) of 0.105 and weighted average of 47.1%, a difference of 2.2%.
Currently Married Correlation Summary
| Measurement | Basque | Guamanian/Chamorro |
| Minimum | 22.6% | 33.7% |
| Maximum | 98.4% | 72.4% |
| Range | 75.8% | 38.7% |
| Mean | 54.1% | 51.5% |
| Median | 52.0% | 49.5% |
| Interquartile 25% (IQ1) | 47.6% | 45.6% |
| Interquartile 75% (IQ3) | 60.5% | 58.9% |
| Interquartile Range (IQR) | 12.9% | 13.3% |
| Standard Deviation (Sample) | 12.9% | 9.5% |
| Standard Deviation (Population) | 12.9% | 9.4% |
Similar Demographics by Currently Married
Demographics Similar to Basques by Currently Married
In terms of currently married, the demographic groups most similar to Basques are Immigrants from Belarus (48.1%, a difference of 0.020%), Slovene (48.1%, a difference of 0.020%), Immigrants from Belgium (48.1%, a difference of 0.030%), Immigrants from South Africa (48.1%, a difference of 0.040%), and Immigrants from Poland (48.1%, a difference of 0.080%).
| Demographics | Rating | Rank | Currently Married |
| Canadians | 98.1 /100 | #69 | Exceptional 48.3% |
| Immigrants | Asia | 97.9 /100 | #70 | Exceptional 48.3% |
| Macedonians | 97.9 /100 | #71 | Exceptional 48.3% |
| Immigrants | Lebanon | 97.6 /100 | #72 | Exceptional 48.2% |
| Immigrants | Eastern Asia | 97.5 /100 | #73 | Exceptional 48.2% |
| Estonians | 97.4 /100 | #74 | Exceptional 48.2% |
| Immigrants | Belarus | 97.2 /100 | #75 | Exceptional 48.1% |
| Basques | 97.2 /100 | #76 | Exceptional 48.1% |
| Slovenes | 97.1 /100 | #77 | Exceptional 48.1% |
| Immigrants | Belgium | 97.1 /100 | #78 | Exceptional 48.1% |
| Immigrants | South Africa | 97.0 /100 | #79 | Exceptional 48.1% |
| Immigrants | Poland | 96.9 /100 | #80 | Exceptional 48.1% |
| Immigrants | Sri Lanka | 96.9 /100 | #81 | Exceptional 48.1% |
| Immigrants | Europe | 96.9 /100 | #82 | Exceptional 48.1% |
| Bolivians | 96.9 /100 | #83 | Exceptional 48.1% |
Demographics Similar to Guamanians/Chamorros by Currently Married
In terms of currently married, the demographic groups most similar to Guamanians/Chamorros are Venezuelan (47.1%, a difference of 0.010%), Argentinean (47.1%, a difference of 0.010%), Hmong (47.1%, a difference of 0.040%), Cajun (47.1%, a difference of 0.050%), and Immigrants from South Eastern Asia (47.1%, a difference of 0.060%).
| Demographics | Rating | Rank | Currently Married |
| Immigrants | Vietnam | 78.2 /100 | #136 | Good 47.2% |
| Paraguayans | 77.8 /100 | #137 | Good 47.2% |
| Pakistanis | 77.5 /100 | #138 | Good 47.2% |
| Yugoslavians | 77.4 /100 | #139 | Good 47.2% |
| Cajuns | 75.3 /100 | #140 | Good 47.1% |
| Venezuelans | 74.4 /100 | #141 | Good 47.1% |
| Argentineans | 74.4 /100 | #142 | Good 47.1% |
| Guamanians/Chamorros | 74.2 /100 | #143 | Good 47.1% |
| Hmong | 73.4 /100 | #144 | Good 47.1% |
| Immigrants | South Eastern Asia | 72.9 /100 | #145 | Good 47.1% |
| Carpatho Rusyns | 72.6 /100 | #146 | Good 47.0% |
| Immigrants | Argentina | 72.0 /100 | #147 | Good 47.0% |
| Cambodians | 70.4 /100 | #148 | Good 47.0% |
| Zimbabweans | 70.1 /100 | #149 | Good 47.0% |
| Immigrants | Turkey | 70.0 /100 | #150 | Good 47.0% |