Basque vs French Currently Married
COMPARE
Basque
French
Currently Married
Currently Married Comparison
Basques
French
48.1%
CURRENTLY MARRIED
97.2/ 100
METRIC RATING
76th/ 347
METRIC RANK
48.4%
CURRENTLY MARRIED
98.6/ 100
METRIC RATING
58th/ 347
METRIC RANK
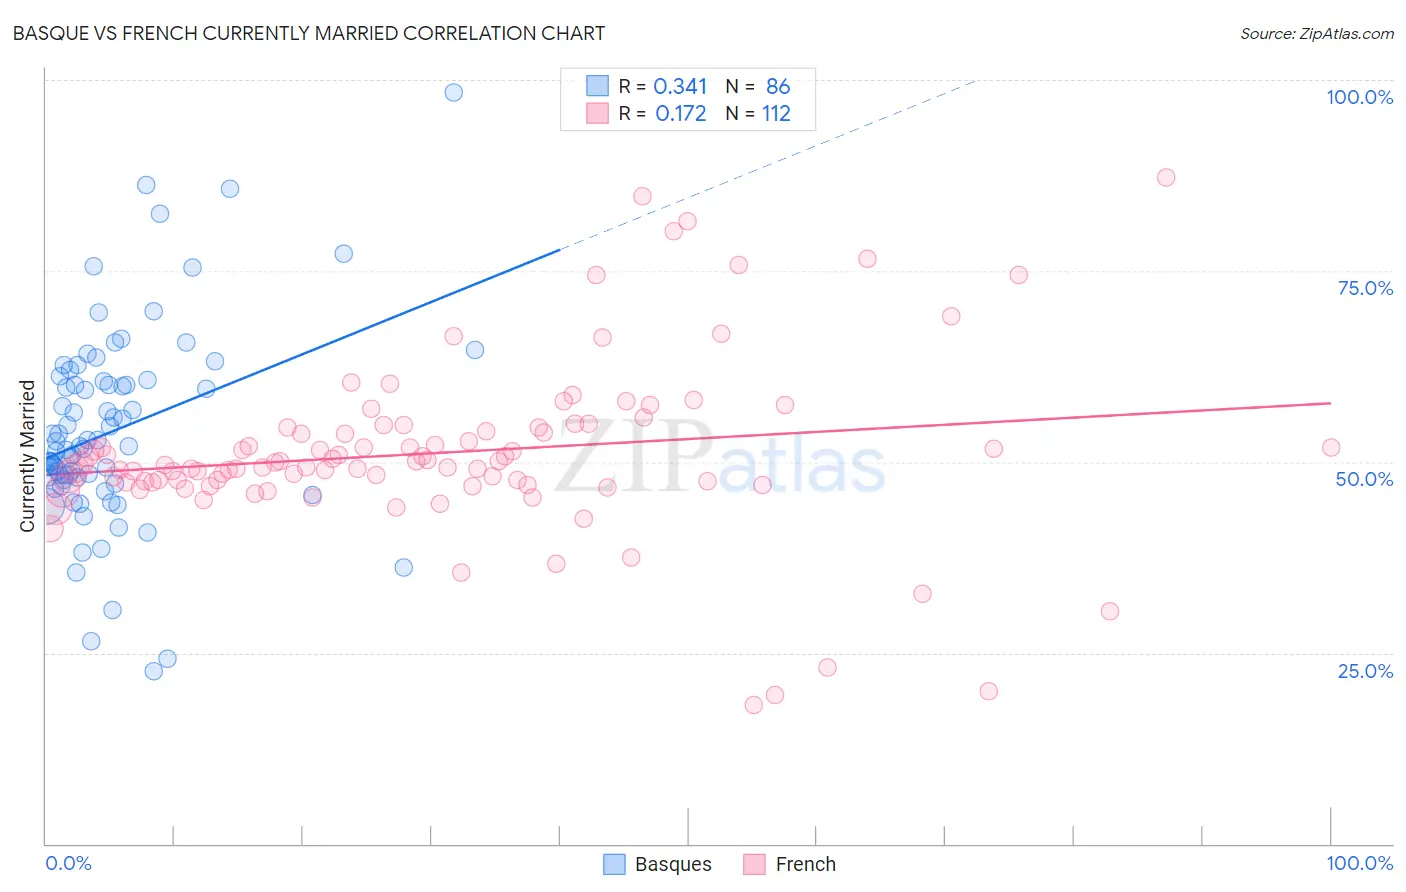
Basque vs French Currently Married Correlation Chart
The statistical analysis conducted on geographies consisting of 165,765,037 people shows a mild positive correlation between the proportion of Basques and percentage of population currently married in the United States with a correlation coefficient (R) of 0.341 and weighted average of 48.1%. Similarly, the statistical analysis conducted on geographies consisting of 572,298,467 people shows a poor positive correlation between the proportion of French and percentage of population currently married in the United States with a correlation coefficient (R) of 0.172 and weighted average of 48.4%, a difference of 0.62%.
Currently Married Correlation Summary
| Measurement | Basque | French |
| Minimum | 22.6% | 18.1% |
| Maximum | 98.4% | 87.2% |
| Range | 75.8% | 69.1% |
| Mean | 54.1% | 51.2% |
| Median | 52.0% | 49.6% |
| Interquartile 25% (IQ1) | 47.6% | 47.3% |
| Interquartile 75% (IQ3) | 60.5% | 54.2% |
| Interquartile Range (IQR) | 12.9% | 6.9% |
| Standard Deviation (Sample) | 12.9% | 11.4% |
| Standard Deviation (Population) | 12.9% | 11.3% |
Demographics Similar to Basques and French by Currently Married
In terms of currently married, the demographic groups most similar to Basques are Immigrants from Belarus (48.1%, a difference of 0.020%), Slovene (48.1%, a difference of 0.020%), Estonian (48.2%, a difference of 0.090%), Immigrants from Eastern Asia (48.2%, a difference of 0.12%), and Immigrants from Lebanon (48.2%, a difference of 0.14%). Similarly, the demographic groups most similar to French are Immigrants from Ireland (48.4%, a difference of 0.030%), Immigrants from Netherlands (48.5%, a difference of 0.040%), Immigrants from Romania (48.4%, a difference of 0.040%), Romanian (48.4%, a difference of 0.050%), and Asian (48.4%, a difference of 0.060%).
| Demographics | Rating | Rank | Currently Married |
| Immigrants | Netherlands | 98.6 /100 | #57 | Exceptional 48.5% |
| French | 98.6 /100 | #58 | Exceptional 48.4% |
| Immigrants | Ireland | 98.5 /100 | #59 | Exceptional 48.4% |
| Immigrants | Romania | 98.5 /100 | #60 | Exceptional 48.4% |
| Romanians | 98.5 /100 | #61 | Exceptional 48.4% |
| Asians | 98.5 /100 | #62 | Exceptional 48.4% |
| Slavs | 98.3 /100 | #63 | Exceptional 48.4% |
| Immigrants | Czechoslovakia | 98.3 /100 | #64 | Exceptional 48.4% |
| Ukrainians | 98.3 /100 | #65 | Exceptional 48.4% |
| Tongans | 98.2 /100 | #66 | Exceptional 48.3% |
| Slovaks | 98.2 /100 | #67 | Exceptional 48.3% |
| Immigrants | England | 98.2 /100 | #68 | Exceptional 48.3% |
| Canadians | 98.1 /100 | #69 | Exceptional 48.3% |
| Immigrants | Asia | 97.9 /100 | #70 | Exceptional 48.3% |
| Macedonians | 97.9 /100 | #71 | Exceptional 48.3% |
| Immigrants | Lebanon | 97.6 /100 | #72 | Exceptional 48.2% |
| Immigrants | Eastern Asia | 97.5 /100 | #73 | Exceptional 48.2% |
| Estonians | 97.4 /100 | #74 | Exceptional 48.2% |
| Immigrants | Belarus | 97.2 /100 | #75 | Exceptional 48.1% |
| Basques | 97.2 /100 | #76 | Exceptional 48.1% |
| Slovenes | 97.1 /100 | #77 | Exceptional 48.1% |