Austrian vs Immigrants from Zimbabwe Currently Married
COMPARE
Austrian
Immigrants from Zimbabwe
Currently Married
Currently Married Comparison
Austrians
Immigrants from Zimbabwe
48.7%
CURRENTLY MARRIED
99.2/ 100
METRIC RATING
48th/ 347
METRIC RANK
46.7%
CURRENTLY MARRIED
52.4/ 100
METRIC RATING
171st/ 347
METRIC RANK
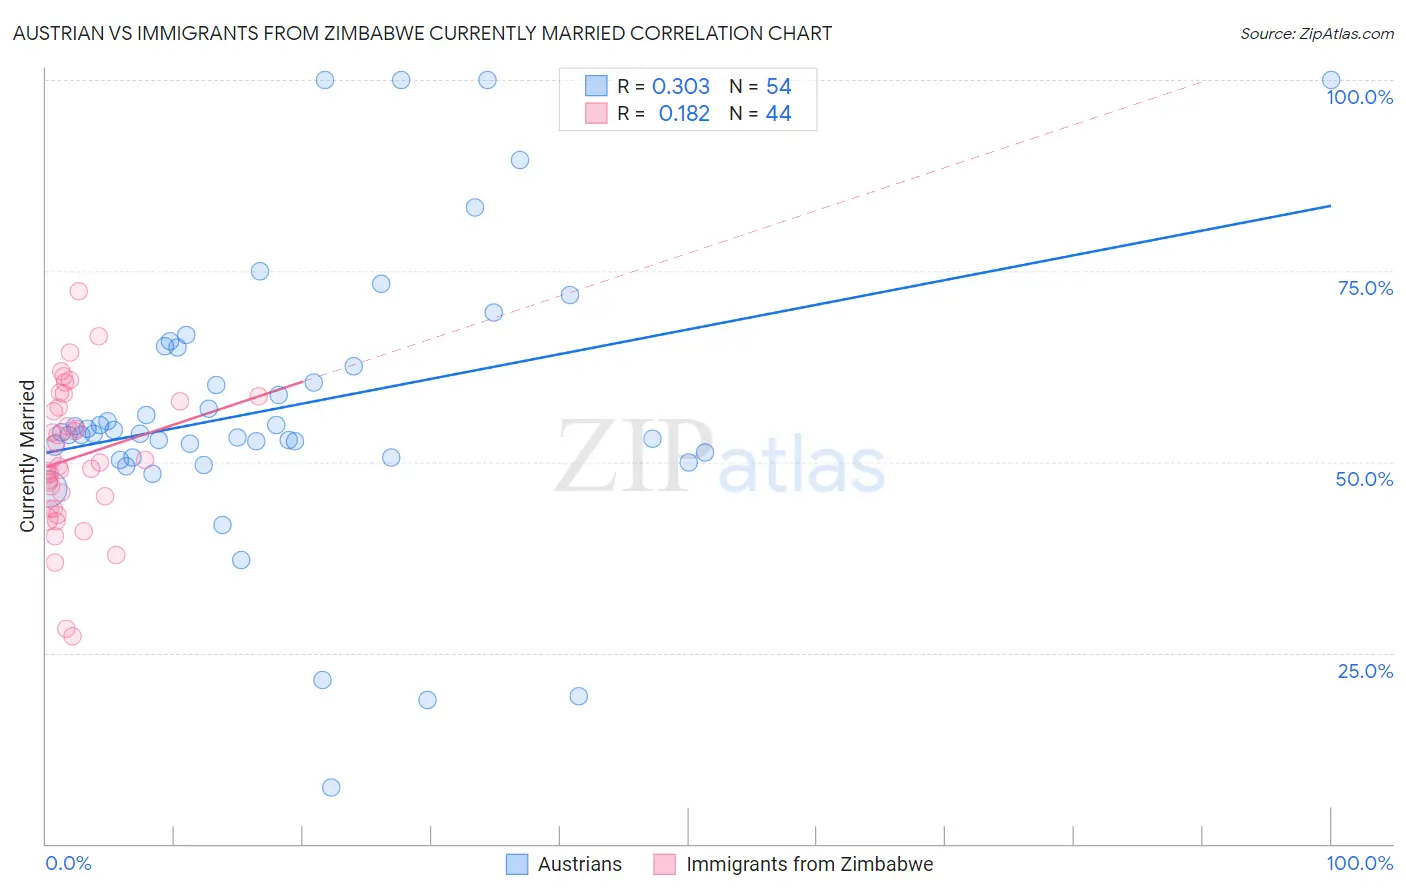
Austrian vs Immigrants from Zimbabwe Currently Married Correlation Chart
The statistical analysis conducted on geographies consisting of 452,025,690 people shows a mild positive correlation between the proportion of Austrians and percentage of population currently married in the United States with a correlation coefficient (R) of 0.303 and weighted average of 48.7%. Similarly, the statistical analysis conducted on geographies consisting of 117,813,548 people shows a poor positive correlation between the proportion of Immigrants from Zimbabwe and percentage of population currently married in the United States with a correlation coefficient (R) of 0.182 and weighted average of 46.7%, a difference of 4.3%.
Currently Married Correlation Summary
| Measurement | Austrian | Immigrants from Zimbabwe |
| Minimum | 7.4% | 27.1% |
| Maximum | 100.0% | 72.3% |
| Range | 92.6% | 45.2% |
| Mean | 57.2% | 50.5% |
| Median | 53.8% | 49.7% |
| Interquartile 25% (IQ1) | 50.6% | 44.7% |
| Interquartile 75% (IQ3) | 64.9% | 57.6% |
| Interquartile Range (IQR) | 14.3% | 12.9% |
| Standard Deviation (Sample) | 18.6% | 9.3% |
| Standard Deviation (Population) | 18.5% | 9.2% |
Similar Demographics by Currently Married
Demographics Similar to Austrians by Currently Married
In terms of currently married, the demographic groups most similar to Austrians are Northern European (48.7%, a difference of 0.010%), Immigrants from Iran (48.7%, a difference of 0.020%), Belgian (48.7%, a difference of 0.050%), Immigrants from North America (48.7%, a difference of 0.080%), and Finnish (48.8%, a difference of 0.11%).
| Demographics | Rating | Rank | Currently Married |
| Greeks | 99.3 /100 | #41 | Exceptional 48.8% |
| Finns | 99.3 /100 | #42 | Exceptional 48.8% |
| Scotch-Irish | 99.3 /100 | #43 | Exceptional 48.7% |
| Immigrants | North America | 99.3 /100 | #44 | Exceptional 48.7% |
| Belgians | 99.3 /100 | #45 | Exceptional 48.7% |
| Immigrants | Iran | 99.2 /100 | #46 | Exceptional 48.7% |
| Northern Europeans | 99.2 /100 | #47 | Exceptional 48.7% |
| Austrians | 99.2 /100 | #48 | Exceptional 48.7% |
| Bhutanese | 99.1 /100 | #49 | Exceptional 48.6% |
| Iranians | 99.0 /100 | #50 | Exceptional 48.6% |
| Whites/Caucasians | 99.0 /100 | #51 | Exceptional 48.6% |
| Russians | 98.9 /100 | #52 | Exceptional 48.6% |
| Immigrants | Austria | 98.8 /100 | #53 | Exceptional 48.5% |
| Immigrants | Moldova | 98.7 /100 | #54 | Exceptional 48.5% |
| Immigrants | North Macedonia | 98.7 /100 | #55 | Exceptional 48.5% |
Demographics Similar to Immigrants from Zimbabwe by Currently Married
In terms of currently married, the demographic groups most similar to Immigrants from Zimbabwe are Aleut (46.7%, a difference of 0.010%), Tlingit-Haida (46.7%, a difference of 0.050%), Peruvian (46.6%, a difference of 0.090%), Immigrants from Brazil (46.6%, a difference of 0.090%), and Hawaiian (46.6%, a difference of 0.14%).
| Demographics | Rating | Rank | Currently Married |
| Immigrants | Western Asia | 64.2 /100 | #164 | Good 46.9% |
| Samoans | 59.8 /100 | #165 | Average 46.8% |
| Immigrants | Syria | 59.3 /100 | #166 | Average 46.8% |
| Spaniards | 58.8 /100 | #167 | Average 46.8% |
| Immigrants | Afghanistan | 58.2 /100 | #168 | Average 46.8% |
| Armenians | 58.2 /100 | #169 | Average 46.8% |
| Immigrants | Latvia | 56.7 /100 | #170 | Average 46.7% |
| Immigrants | Zimbabwe | 52.4 /100 | #171 | Average 46.7% |
| Aleuts | 52.0 /100 | #172 | Average 46.7% |
| Tlingit-Haida | 51.2 /100 | #173 | Average 46.7% |
| Peruvians | 50.0 /100 | #174 | Average 46.6% |
| Immigrants | Brazil | 49.9 /100 | #175 | Average 46.6% |
| Hawaiians | 48.6 /100 | #176 | Average 46.6% |
| Israelis | 48.6 /100 | #177 | Average 46.6% |
| Chickasaw | 47.8 /100 | #178 | Average 46.6% |